Your B2B SaaS company might be bleeding money—and you may not even realize it.
While you’re celebrating your latest funding round or that shiny quarterly growth milestone, a silent killer could be lurking in your unit economics: an unsustainably high customer acquisition cost (CAC) that’s slowly choking your business.
The harsh reality is that most SaaS founders, CMOs, and CFOs are flying blind when it comes to their true CAC. They’re making decisions based on incomplete data, overlooking critical cost components, and falling into traps that can cripple even the most promising startups.
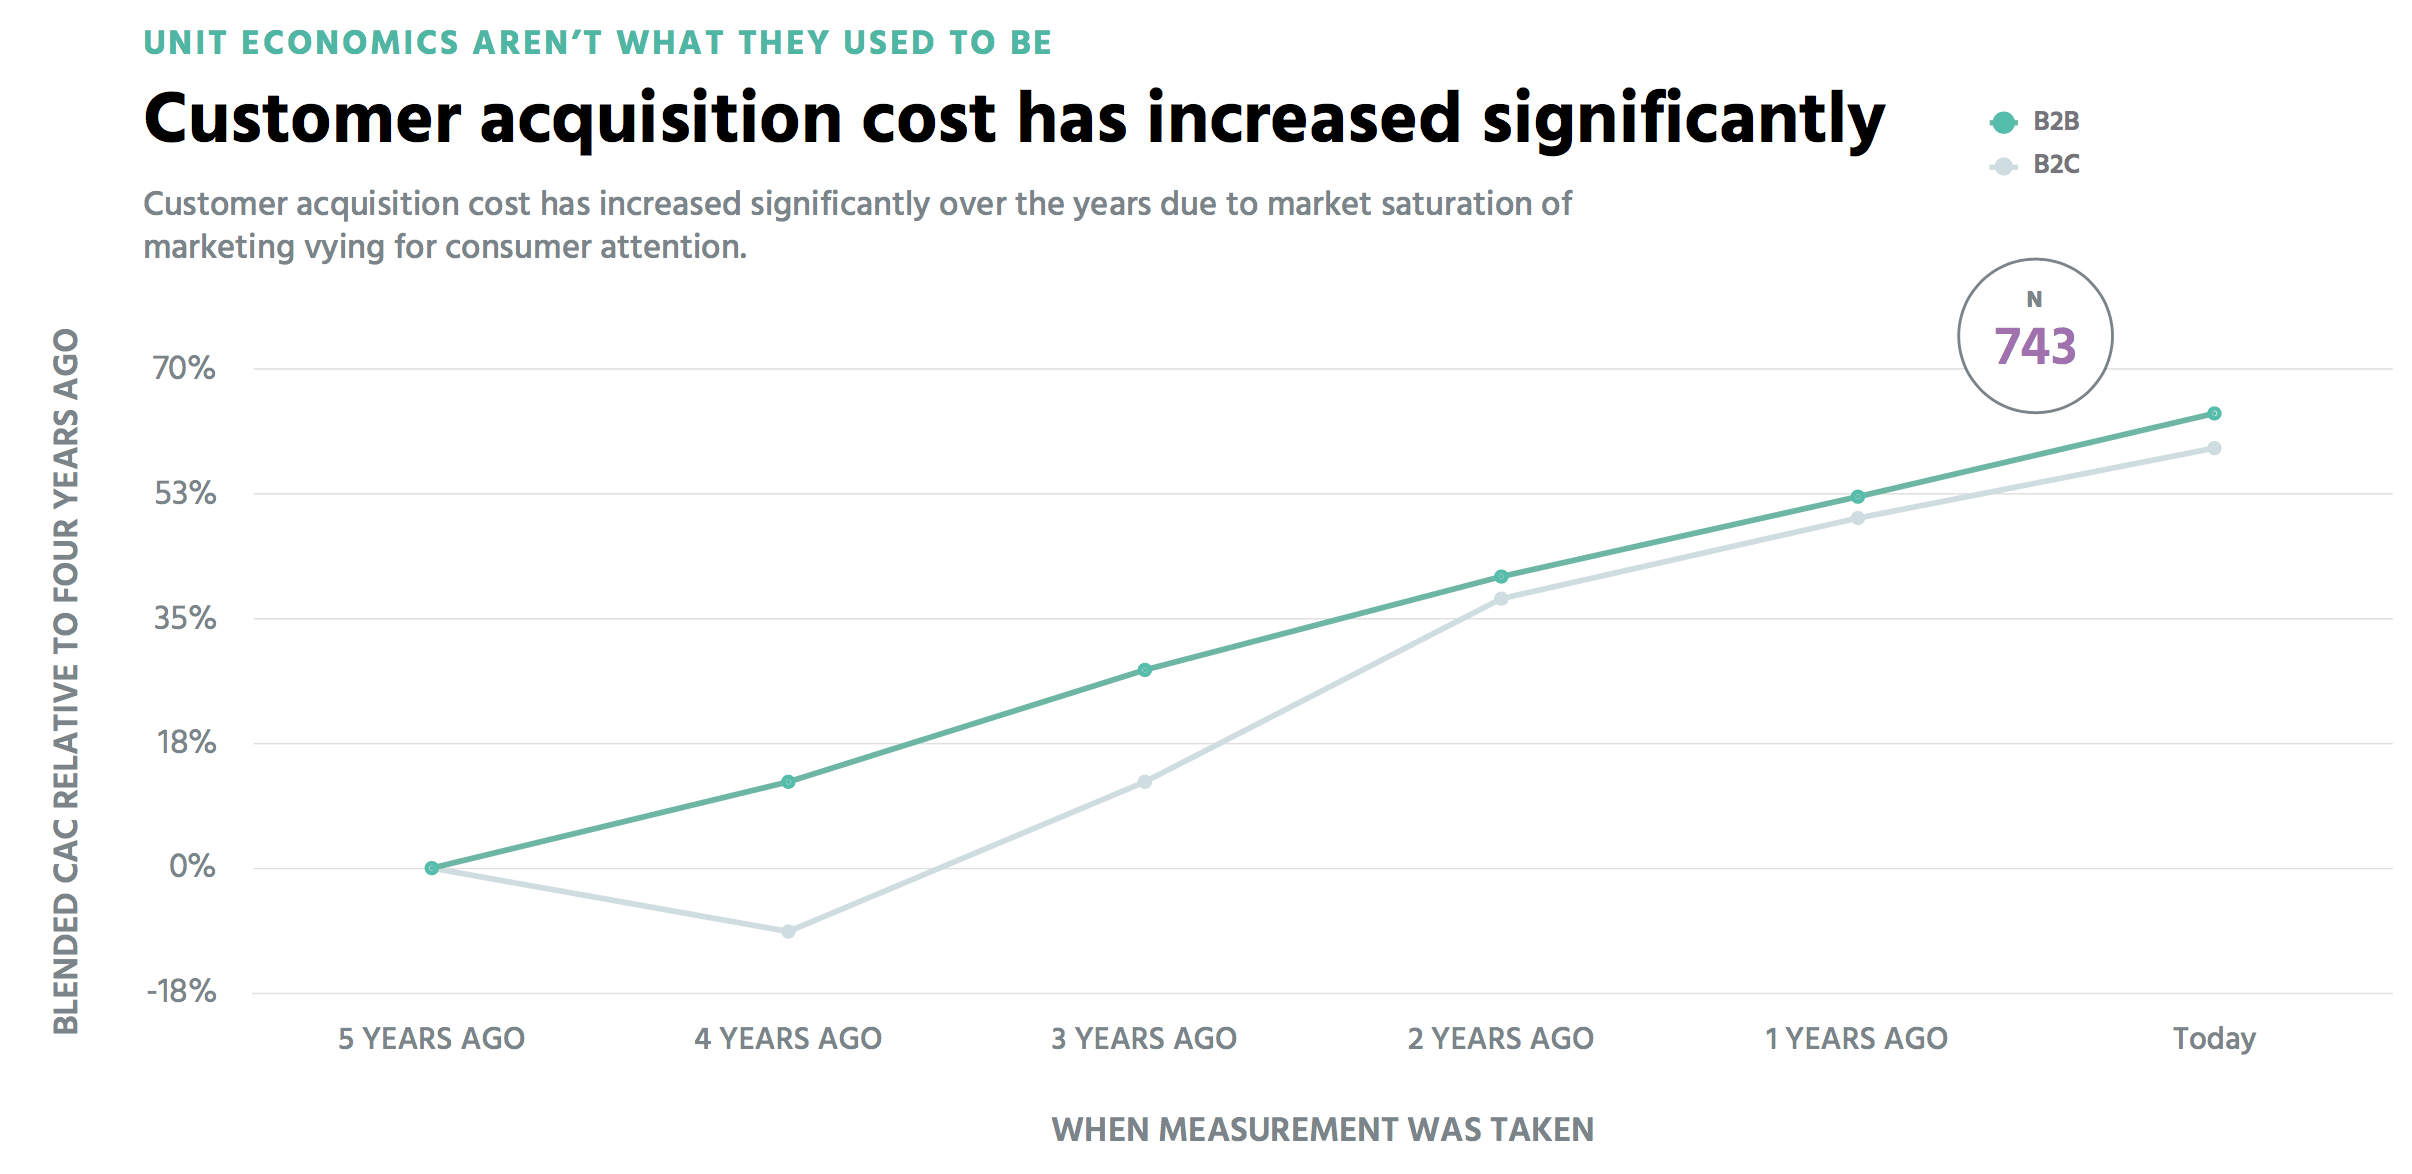
Here’s a wake-up call: according to recent industry data, CAC rose by 60–75% for both B2C and B2B companies between 2014 and 2019—and the trend has only accelerated since. Today, the average B2B SaaS company spends anywhere from $299 to $14,774 to acquire a single customer, depending on its industry and target market.
But here’s what’s truly alarming: if your CAC is too high relative to your customer lifetime value (LTV), you’re effectively paying customers to use your product. Every new signup pushes you closer to bankruptcy instead of profitability.
The CAC Crisis: Why This Matters More Than Ever
The current economic climate has made efficient customer acquisition not just important—it’s existential. With venture capital becoming scarcer and investors demanding profitability over growth-at-all-costs, B2B SaaS companies with bloated CACs are facing an impossible equation.
The numbers don’t lie. According to First Page Sage’s comprehensive analysis of B2B SaaS companies, CAC varies dramatically by industry and customer segment:
- Fintech companies face the steepest acquisition costs—ranging from $1,461 for small business customers to a staggering $14,774 for enterprise clients.
- eCommerce SaaS enjoys the lowest costs, spending around $299 to acquire small businesses, though enterprise acquisition still climbs to $2,206.
- Security and telecommunications companies regularly pour $10,000+ into acquiring each enterprise customer.
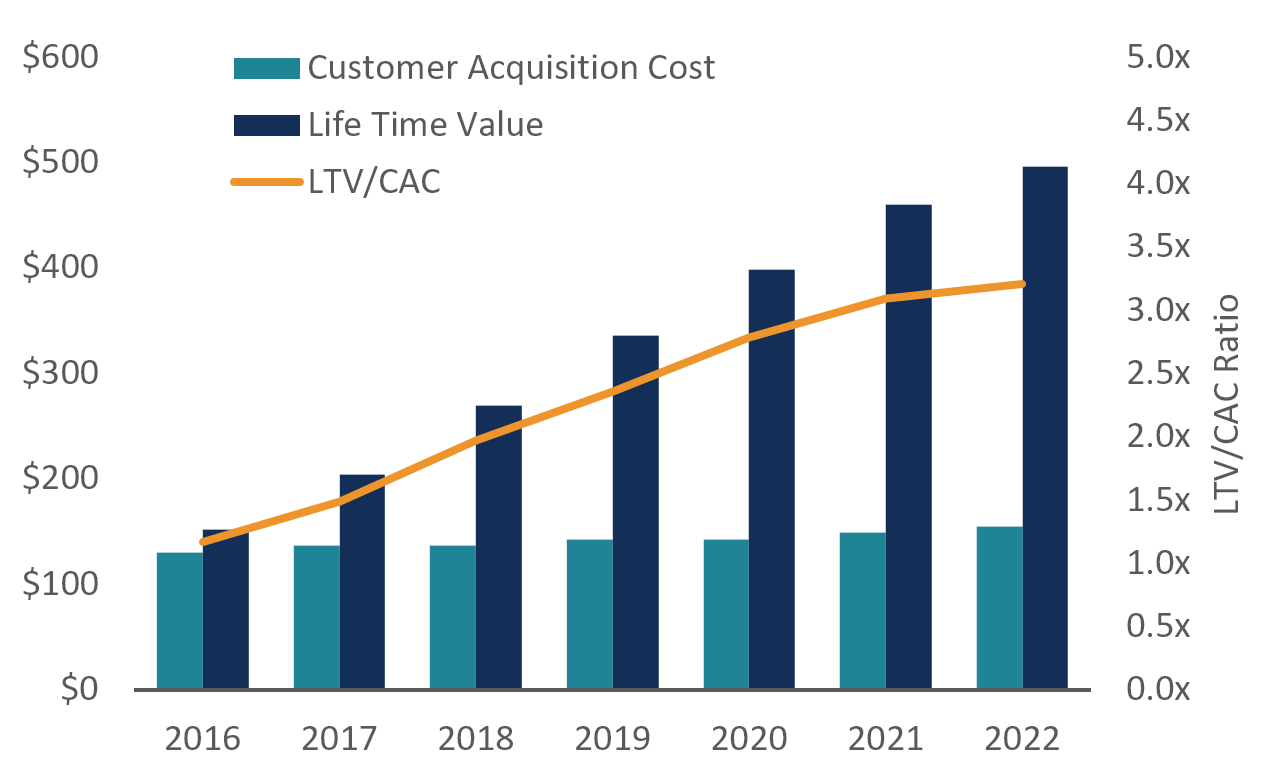
But raw CAC numbers only tell part of the story. The real danger hides in the CAC-to-LTV ratio. Industry best practice says your LTV should be at least three times your CAC (3:1) just to stay sustainable. A healthy, growth-ready company aims for 5:1. Anything lower, and you’re essentially subsidizing your customers—paying them to use your product.
Understanding the Hidden CAC Iceberg
Most SaaS companies dramatically underestimate their true customer acquisition cost because they only measure what’s visible—the tip of the iceberg. They track direct ad spend and obvious sales costs, but the real picture runs far deeper. Hidden expenses—spanning tech infrastructure, overhead, and support functions—can easily double or even triple your true CAC.
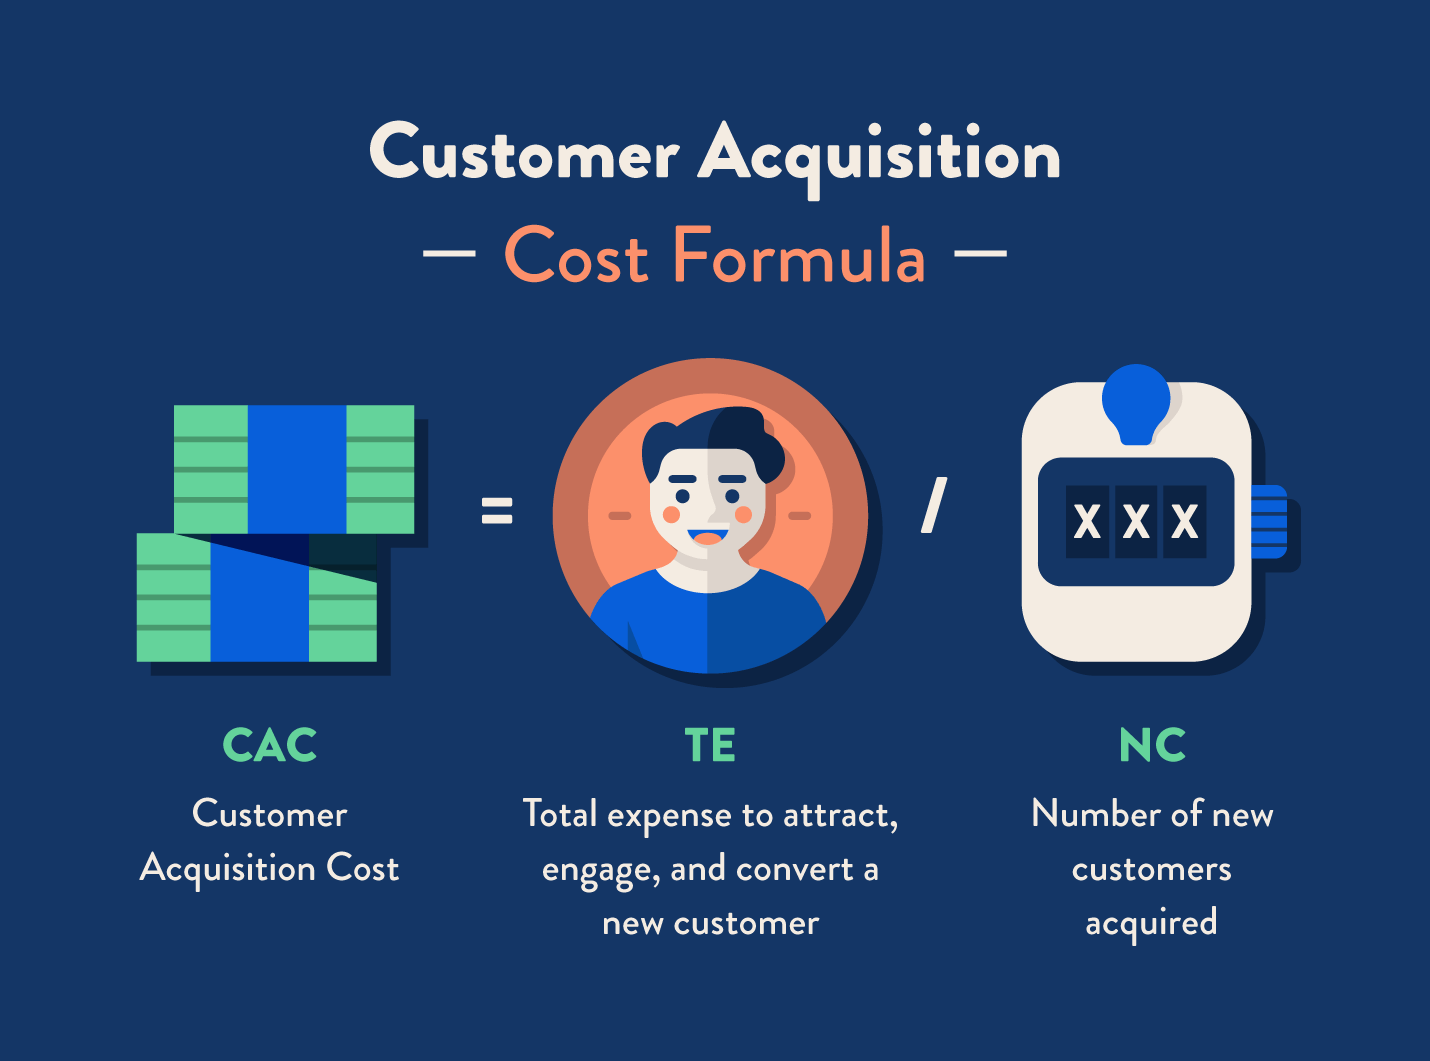
Here’s the complete CAC formula every B2B SaaS leader should be using:
CAC = (Sales Expenses + Marketing Expenses + Technology Costs + Overhead Allocation) / Number of New Customers Acquired
Each component covers far more than most teams realize:
- Sales Expenses: Salaries, commissions, bonuses, benefits, travel, entertainment, sales tools, and CRM software
- Marketing Expenses: Ad spend, content creation, events, PR, marketing automation, and lead-generation tools
- Technology Costs: Website development, analytics platforms, attribution software, and testing tools
- Overhead Allocation: A portion of rent, utilities, legal, accounting, and management time tied to customer acquisition
Behind every “profitable” campaign might be a hidden cost center silently dragging down your unit economics. Recognizing the full CAC picture is the first step toward reclaiming profitability—and building a growth engine that actually scales.
This broader, more accurate view often uncovers a hard truth—many companies are spending two to three times more on acquisition than they realize. A team that proudly reports a $500 CAC might discover their true cost is closer to $1,500 once every hidden expense is factored in.
The 15 Hidden Reasons Your CAC is Killing Your Business
After analyzing hundreds of SaaS companies and their customer acquisition challenges, we’ve uncovered 15 critical reasons why CAC quietly spirals out of control. These issues fall into four main categories: targeting mistakes, process breakdowns, tech and data blind spots, and strategic gaps.
Category 1: Targeting Issues
The foundation of efficient customer acquisition lies in targeting the right prospects with the right message at the right time. When that foundation cracks, every dollar spent becomes exponentially less effective.
1. Pursuing the Wrong Ideal Customer Profile (ICP)
The most expensive mistake in SaaS acquisition is chasing customers who will never turn profitable. This happens when companies pursue big logos and large deal sizes without considering the full cost of acquisition and retention.
Why it happens: Founders and sales teams often get seduced by prestige and potential contract value. They assume that bigger customers automatically mean better unit economics—but that’s not always true.
How to diagnose it: Calculate CAC and LTV by customer segment. Watch for patterns where your “largest” deals actually generate poor or even negative margins when you factor in long sales cycles, heavy customization, or intensive support.
Quick fixes:
- Segment customers by profitability, not just revenue.
- Calculate true LTV including expansion revenue and churn rates.
- Identify your most profitable customer traits and double down.
- Reassess if mid-market clients deliver better unit economics than enterprise.
Long-term solution: Build a data-driven ICP grounded in unit economics, not vanity metrics. Sometimes, walking away from a big logo is the smartest financial decision you’ll ever make.
2. Too Broad Targeting
Trying to be everything to everyone is a guaranteed way to waste money. When your targeting is too broad, you end up paying premium rates to reach people who will never buy.
Why it happens: Fear of missing opportunities pushes teams to cast wider nets. Marketing worries that narrowing the audience will kill reach—so campaigns speak to everyone and resonate with no one.
How to diagnose it: Check conversion rates by traffic source and audience segment. If paid traffic converts below 2% or organic traffic below 5%, your targeting is likely too broad.
Quick fixes:
- Add negative keywords to exclude irrelevant traffic.
- Build segmented campaigns with tailored messaging.
- Use lookalike audiences modeled on your best customers.
- Apply progressive profiling to deepen segmentation over time.
Long-term solution: Develop data-backed buyer personas—not guesswork. Use real customer data to craft campaigns that speak directly to specific pain points and use cases.
3. Ignoring Intent Signals
Modern buyers do their homework. They research, compare, and evaluate long before talking to sales. Ignoring these intent signals means missing the perfect moment to engage—leading to longer sales cycles and higher CAC.
Why it happens: Many companies don’t have the tools or processes to capture behavioral signals. They rely on outdated lead scoring based on firmographics instead of buying behavior.
How to diagnose it: Analyze correlations between prospect actions and purchase outcomes. What content do buyers engage with before converting? Which behaviors predict purchase readiness?
Quick fixes:
- Deploy intent data platforms to spot in-market prospects.
- Trigger alerts for high-intent actions (pricing pages, comparisons).
- Create nurture sequences for prospects showing strong intent.
- Train sales reps to recognize and prioritize intent signals.
Long-term solution: Build a comprehensive intent-scoring system that blends first-party behavior with third-party signals to surface the hottest leads—automatically.
Category 2: Process Problems
Even with perfect targeting, broken processes can wreck acquisition efficiency. These issues usually creep in as companies scale—and they’re some of the most expensive to ignore.
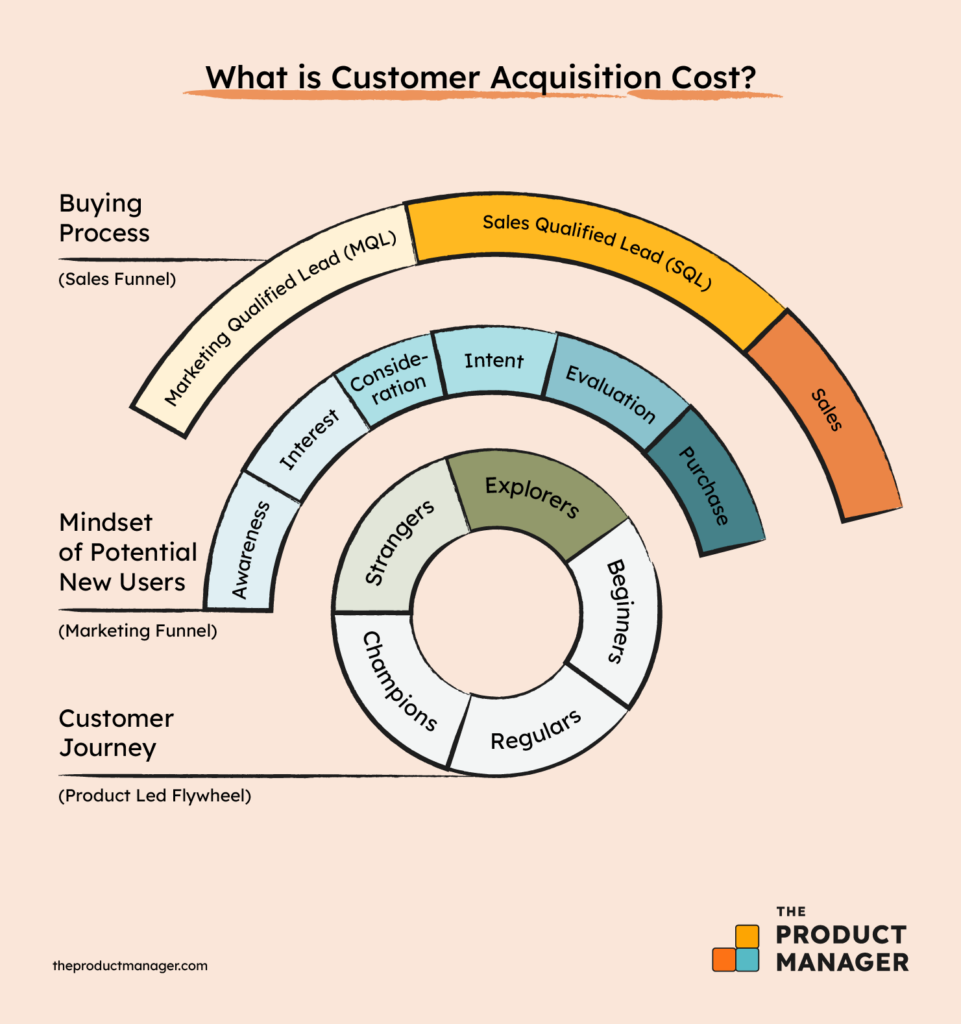
4. Broken Handoffs Between Marketing and Sales
The MQL-to-SQL handoff is where many deals die—and CAC skyrockets. Poor transitions cause delays, misaligned expectations, and frustrated prospects.
Why it happens: Marketing and sales often operate in silos. They use different tools, track different metrics, and lack shared definitions of what a “qualified lead” actually means.
How to diagnose it: Measure response time between MQL creation and first sales contact. Track conversion rates at each stage and collect feedback from lost prospects.
Quick fixes:
- Implement SLAs for lead response times.
- Align on shared qualification criteria.
- Set up automated alerts for hot leads.
- Hold regular marketing-sales syncs.
Long-term solution: Establish a Revenue Operations (RevOps) function to oversee the entire funnel and enforce accountability across both teams.
5. No Lead Scoring or Poor Lead Scoring
Without effective lead scoring, sales teams waste time on cold leads while high-value prospects slip away.
Why it happens: Some companies skip scoring entirely; others create basic models that don’t reflect real buying behavior.
How to diagnose it: Compare conversion rates by lead score. If there’s little difference between high and low scores, your model isn’t predictive.
Quick fixes:
- Implement simple demographic + behavioral scoring.
- Weight recent activity higher than old actions.
- Add negative scoring for low-intent signals.
- Review and refine criteria regularly.
Long-term solution: Move to predictive lead scoring using machine learning to identify combinations of traits that actually correlate with conversions.
6. Poor Sales Follow-up
Even the best marketing efforts crumble without consistent follow-up. Missed or delayed outreach can inflate CAC by 50% or more.
Why it happens: Sales reps often rely on manual reminders or lack defined cadences, leading to inconsistency and lost opportunities.
How to diagnose it: Track response times and conversion rates per follow-up attempt. Measure delays between touches and look for steep drop-offs.
Quick fixes:
- Automate follow-up sequences for different lead types.
- Use templates for common outreach scenarios.
- Set up alerts and reminders for pending contacts.
- Train teams on multi-touch best practices.
Long-term solution: Adopt a sales engagement platform that automates cadence and timing while preserving personalization.
7. Long, Inefficient Sales Cycles
Lengthy sales cycles don’t just slow revenue—they bloat CAC by consuming time, headcount, and budget.
Why it happens: Complex products, unclear value propositions, and process friction all add drag. Many companies never analyze where deals actually stall.
How to diagnose it: Map your sales process and identify choke points. Compare cycle length by deal size, channel, and rep to spot inefficiencies.
Quick fixes:
- Eliminate unnecessary approval steps.
- Provide self-serve resources for faster buyer education.
- Use mutual close plans with clear next steps.
- Train reps to tackle objections early.
Long-term solution: Redesign your process around the buyer’s journey, not internal convenience—reducing friction and accelerating decisions.
Category 3: Tech and Data Issues
In today’s data-driven world, invisible technical problems silently drain your acquisition budget while feeding you misleading metrics.
8. Attribution Blindness
Without solid attribution, optimization becomes guesswork. You’ll keep investing in underperforming channels while underfunding the ones that actually work.
Why it happens: Multi-touch attribution is complex. Many teams default to first-click or last-click models that ignore most of the buyer journey.
How to diagnose it: Compare attribution reports with customer survey data on discovery and evaluation paths. Large discrepancies mean your model is broken.
Quick fixes:
- Use UTM parameters consistently.
- Track all key conversions.
- Use platform-specific tools like GA4 or Meta Attribution.
- Ask customers how they found you—then believe their answers.
Long-term solution: Implement multi-touch attribution modeling that accurately credits every meaningful touchpoint.
9. Data Silos
When customer data lives in separate systems, you lose visibility into the full journey—and your acquisition strategy suffers.
Why it happens: Teams adopt tools independently without planning for integration, creating fragmented ecosystems.
How to diagnose it: Try tracing a customer from first click to purchase. If it feels like detective work, you’ve got silos.
Quick fixes:
- Deploy a Customer Data Platform (CDP) to unify sources.
- Connect key tools via native or API integrations.
- Fill gaps with manual syncs if needed.
- Enforce data governance policies to prevent new silos.
Long-term solution: Build a centralized data architecture that provides a single source of truth for analytics and decision-making.
10. Manual Processes
Manual steps aren’t just slow—they introduce errors, inconsistencies, and inefficiency.
Why it happens: Early-stage companies often start manual and never evolve. They underestimate how much these processes really cost.
How to diagnose it: Document every manual touchpoint in your acquisition flow. Measure the time and error rate attached to each.
Quick fixes:
- Automate lead routing and assignment.
- Use automated email sequences for standard responses.
- Add chatbots for early qualification.
- Eliminate repetitive tasks with workflow automation tools.
Long-term solution: Automate everything that doesn’t require human judgment—freeing your team to focus on what does.
11. Poor Tech Stack Integration
disconnected tech stack kills efficiency and disrupts the smooth experience modern buyers expect.
Why it happens: Teams choose “best-of-breed” tools without checking how they integrate—or fail to implement integrations properly.
How to diagnose it: Map how data flows between your systems. Any point requiring manual transfer or duplicate entry signals friction.
Quick fixes:
- Audit integrations and repair broken links.
- Use native or middleware (like Zapier) where possible.
- Consolidate overlapping tools.
Long-term solution: Architect your tech stack around data flow and interoperability—not tool preference.
Category 4: Strategy Gaps
The most costly CAC problems stem from strategic blind spots that ripple across the entire organization.
12. No Product-Market Fit
Acquiring customers without product-market fit is like pouring water into a bucket full of holes—you’ll never fill it.
Why it happens: Companies mistake early traction for validation or expand to new segments without testing fit first.
How to diagnose it: Review retention rates, NPS, and organic growth. If customers don’t stay or refer others, you don’t have true fit.
Quick fixes:
- Survey churned customers for insights.
- Focus acquisition on your best-fit segments.
- Strengthen customer success programs to improve retention.
- Collect continuous feedback for product refinement.
Long-term solution: Secure genuine product-market fit before scaling. Slower growth now is far better than costly churn later.
13. Pricing Misalignment
Pricing that’s too high blocks adoption; too low devalues your product and attracts the wrong buyers.
Why it happens: Many companies price based on costs or competitors, not perceived value or willingness to pay.
How to diagnose it: Analyze win/loss data and LTV by tier. Frequent price objections or underperforming tiers signal misalignment.
Quick fixes:
- Run A/B tests on pricing strategies.
- Adopt value-based pricing.
- Offer tiered options for different segments.
- Use price anchoring to steer buyers effectively.
Long-term solution: Create a pricing strategy built on customer value perception—and test it regularly.
14. Channel Concentration
Depending too heavily on one acquisition channel is like balancing your business on one leg—it’s risky and unsustainable.
Why it happens: Companies double down on what’s worked before, ignoring diversification until performance drops.
How to diagnose it: If a single channel drives more than 50% of your new customers, you’re overexposed.
Quick fixes:
- Pilot new channels with small budgets.
- Shift spend from saturated to emerging platforms.
- Develop channel-specific strategies.
- Build internal expertise across multiple channels.
Long-term solution: Create a diversified acquisition mix that spreads risk and scales sustainably.
15. Ignoring Expansion Revenue
Focusing only on new customer acquisition while neglecting existing ones leads to inflated CAC and missed growth.
Why it happens: New business and customer success teams operate separately, chasing different KPIs. Expansion becomes an afterthought.
How to diagnose it: Calculate net revenue retention (NRR) and compare expansion revenue vs. new revenue. If expansion contributes less than 20%, opportunity is being left on the table.
Quick fixes:
- Build upsell and cross-sell programs.
- Align CS processes around expansion goals.
- Design products that enable growth within accounts.
- Incentivize both acquisition and expansion in comp plans.
Long-term solution: Make expansion revenue a core growth pillar. Treat existing customers as your most valuable—and cost-effective—acquisition channel.
The CAC Reduction Framework: A Systematic Approach to Fixing Your Unit Economics
Now that you understand the 15 hidden reasons your CAC might be too high, you need a systematic approach to identify and fix these issues in your business. The CAC Reduction Framework provides a step-by-step methodology for diagnosing problems and implementing solutions.
Phase 1: Audit and Baseline (Weeks 1–2)
The first step is understanding your current state with brutal honesty. Most companies discover their true CAC is 50-100% higher than they initially calculated.
Step 1: Calculate True CAC
Start with a comprehensive CAC calculation that includes all costs:
- Direct advertising spend across all channels
- Sales team salaries, commissions, and benefits
- Marketing team compensation and contractor costs
- Technology costs (CRM, marketing automation, analytics tools)
- Content creation and creative development costs
- Event and conference expenses
- Allocated overhead (office space, utilities, management time)
Step 2: Segment CAC by Key Dimensions
Break down your CAC analysis by:
- Customer segment (SMB, mid-market, enterprise)
- Acquisition channel (paid search, content marketing, referrals, etc.)
- Geographic region
- Product line or use case
- Sales rep or marketing campaign
Step 3: Establish Baseline Metrics
Document your current performance across key metrics:
- Overall blended CAC
- CAC by segment and channel
- LTV:CAC ratio by segment
- CAC payback period
- Conversion rates at each funnel stage
- Sales cycle length by segment
Phase 2: Identify Priority Issues (Weeks 3–4)
Use the 15 hidden reasons as a diagnostic checklist to identify your biggest opportunities for improvement.
High-Impact, Quick-Win Issues:
- Attribution problems (can often be fixed in days)
- Poor lead scoring (can be improved in weeks)
- Broken marketing-sales handoffs (process fixes)
- Manual processes that can be automated
Medium-Impact, Medium-Effort Issues:
- Targeting optimization
- Sales process improvements
- Tech stack integration
- Pricing optimization
High-Impact, Long-Term Issues:
- Product-market fit problems
- Channel diversification
- Fundamental strategy shifts
Phase 3: Implement Quick Wins (Weeks 5–8)
Start with the changes that can deliver immediate impact with minimal effort or investment.
Week 5–6: Fix Attribution and Tracking
- Implement proper UTM tracking across all campaigns
- Set up conversion tracking for all key actions
- Fix broken integrations between marketing and sales tools
- Establish baseline measurement for all channels
Week 7–8: Optimize Lead Management
- Implement or improve lead scoring models
- Set up automated lead routing and assignment
- Create SLAs for sales follow-up
- Establish regular marketing-sales alignment meetings
Phase 4: Systematic Optimization (Weeks 9–16)
With quick wins implemented, focus on systematic optimization of your highest-impact opportunities.
Targeting Optimization:
- Analyze your most profitable customer segments
- Create detailed buyer personas based on actual data
- Implement negative keywords and audience exclusions
- Test new targeting approaches with small budgets
Process Improvements:
- Map and optimize your sales process
- Implement sales enablement tools and content
- Create automated nurture sequences for different lead types
- Establish mutual close plans and clear next steps
Technology Upgrades:
- Implement multi-touch attribution modeling
- Integrate key systems to eliminate data silos
- Automate repetitive manual processes
- Upgrade tools that are limiting your effectiveness
Phase 5: Strategic Initiatives (Weeks 17-24)
Address fundamental strategic issues that require longer-term commitment and investment.
Product-Market Fit Enhancement:
- Conduct deep customer research to understand value drivers
- Implement customer success programs to improve retention
- Develop features that increase customer stickiness
- Focus acquisition on segments with strongest fit
Channel Diversification:
- Test new acquisition channels with small experiments
- Develop channel-specific strategies and content
- Build expertise in multiple acquisition methods
- Gradually shift budget from saturated to emerging channels
Pricing Optimization:
- Conduct pricing research and willingness-to-pay studies
- Test different pricing models and structures
- Implement value-based pricing aligned with outcomes
- Create pricing tiers that capture different customer segments
Case Studies: Companies That Dramatically Reduced CAC
Learning from SaaS leaders who turned their CAC challenges into growth opportunities offers not just inspiration—it provides battle-tested strategies you can apply immediately. These companies didn’t just trim costs; they redesigned how acquisition works, proving that efficiency and scale can coexist when strategy meets creativity.
Case Study 1: HubSpot’s Content-Driven CAC Reduction
The Challenge: HubSpot faced a classic SaaS dilemma: how to scale customer acquisition while maintaining strong unit economics in an increasingly crowded marketing automation market. Paid acquisition costs were rising fast, and the team needed a sustainable way to attract customers without burning cash.
The Strategy: Instead of outspending competitors, HubSpot chose to out-educate them. They doubled down on content marketing, building a library of resources that turned prospects into loyal fans long before they spoke to sales. By pioneering the concept of inbound marketing, HubSpot made education—not advertising—the engine of growth.
Key Tactics:
- Published 3–4 expert-level blog posts daily covering marketing, sales, and customer service.
- Created comprehensive resources—ebooks, certification programs, and entire online courses.
- Developed free tools and calculators (like the Website Grader) that delivered instant value.
- Built a passionate community around the inbound marketing methodology.
The Results:
- 60% reduction in CAC within five years.
- 215% increase in overall revenue during the same period.
- Organic traffic became the leading source of customer acquisition.
- HubSpot cemented its status as the thought leader in inbound marketing.
- 60% reduction in customer acquisition cost over five years
- 215% increase in revenue during the same period
- Organic traffic became the primary source of new customers
- Established market leadership position in inbound marketing
Key Lessons:
- Educational content can slash paid acquisition costs.
- Thought leadership creates long-term brand equity and trust.
- Building a community amplifies every content investment.
- Content compounds—the longer you invest, the greater the ROI.
Takeaway: HubSpot turned marketing into a profit center. When your content delivers genuine value, you stop chasing leads—and start attracting believers.
Case Study 2: Dropbox’s Viral Referral Program
The Challenge: In the early 2010s, Dropbox faced a brutally competitive market dominated by giants like Google Drive and Box. With limited marketing budgets, they needed a cost-effective, scalable acquisition strategy that could compete with well-funded incumbents.
The Strategy: Dropbox built a viral referral program that turned every user into a growth engine. Instead of relying on expensive ads, they embedded their acquisition model directly into the product experience.
Key Tactics:
- Offered free storage space to both referrers and referees.
- Simplified the referral process with in-app sharing and one-click invites.
- Created a clear mutual benefit—everyone gained more space.
- Leveraged network effects, encouraging users to recruit friends and colleagues.
The Results:
- 60% increase in signups from the referral program
- Grew from 100,000 to 4 million users in just 15 months
- Referrals became the primary growth driver
- Achieved viral coefficient greater than 1.0
Key Lessons:
- Product-embedded referrals outperform standalone programs.
- Simple, tangible incentives (like free storage) drive adoption better than complex rewards.
- Viral loops can turn your product into its own marketing engine.
- True virality comes from ease of sharing and clear value exchange.
Takeaway: Dropbox proved that when your users become your marketers, growth compounds without additional spend.
Case Study 3: Airbnb’s SEO and Social Media Strategy
The Challenge: Airbnb was trying to redefine travel in an era dominated by hotels and OTAs (Online Travel Agencies). As a startup pioneering a new category—home-sharing—they had to build trust, awareness, and adoption from scratch, all while competing against brands with deep pockets.
The Strategy: Airbnb combined search engine optimization, social media storytelling, and community building to fuel low-cost, organic growth. The company understood that every host and guest could become a content creator and brand ambassador.
Key Tactics:
- Optimized individual listing pages for local search terms to rank in organic results.
- Encouraged hosts and guests to share experiences on social media.
- Created city guides and localized content that connected users to real communities.
- Promoted user-generated content, reinforcing authenticity and social proof.
The Results:
- 50% reduction in CAC within two years.
- 10x increase in revenue as organic channels became dominant.
- SEO-driven traffic became the primary acquisition source.
- Cultivated a global brand community that powered word-of-mouth growth.
Key Lessons:
- SEO builds sustainable, compounding acquisition channels.
- User-generated content multiplies reach at zero marginal cost.
- Community building transforms users into evangelists.
- Local optimization is crucial for marketplace businesses.
Takeaway: Airbnb’s growth wasn’t just about bookings—it was about belonging. When you build a brand people love to talk about, CAC naturally falls.
Case Study 4: Slack’s Product-Led Growth Strategy
The Challenge: Slack entered the workplace communication market facing massive incumbents like Microsoft and entrenched habits around email. The company needed to achieve widespread adoption without massive ad spend.
The Strategy: Slack adopted a product-led growth (PLG) model—focusing on creating a product so valuable and delightful that it spread virally within organizations. They didn’t just sell a tool; they designed an experience teams couldn’t live without.
Key Tactics:
- Offered a freemium model that delivered immediate, tangible value.
- Designed viral features (team invites, integrations) that encouraged organic expansion.
- Prioritized user experience and intuitive onboarding to remove friction.
- Focused on bottom-up adoption, winning over teams before executives.
The Results:
- Achieved hypergrowth with minimal paid acquisition.
- Enjoyed exceptional organic adoption within organizations.
- Became one of the fastest-growing SaaS companies in history.
- Built a brand synonymous with collaboration and efficiency.
Key Lessons:
- Product-led growth turns usage into marketing.
- Freemium can be a powerful driver when the product delivers immediate value.
- Bottom-up adoption often beats top-down sales for B2B SaaS.
- Exceptional UX creates stickiness that lowers CAC over time.
Takeaway: Slack proved that when your product markets itself, your CAC curve bends downward—and your adoption curve skyrockets.
What These Companies Teach Us About Modern CAC Mastery
Across these stories—HubSpot, Dropbox, Airbnb, Slack—a clear pattern emerges: Sustainable CAC reduction comes from building systems that scale without spending more.
- HubSpot used education to attract instead of chase.
- Dropbox leveraged network effects to grow organically.
- Airbnb empowered its community to spread the word.
- Slack made the product itself the most persuasive salesperson.
Each company transformed customer acquisition from a cost center into a growth asset.
Stop thinking of CAC as a fixed number. It’s a reflection of your strategy, your product, and your ability to inspire loyalty. When you align those three, your acquisition costs don’t just drop—they start to pay dividends.
Tools and Templates for CAC Analysis
Effective CAC optimization isn’t guesswork—it’s instrumentation + discipline. The right tools and frameworks help you see the full picture, run smarter experiments, and compound wins over time. Below are the essential resources you need to implement the strategies in this article—plus guidance on how to use each one with confidence.
CAC Calculation Spreadsheet Template
A comprehensive spreadsheet template to calculate true CAC across all channels and customer segments so you can make decisions based on unit economics, not hunches. The template includes:
- Complete cost category breakdowns (sales, marketing, tech, overhead)
- Channel-specific CAC calculations (paid search, paid social, organic, referrals, partnerships, PLG)
- Customer segment analysis (SMB, mid-market, enterprise, verticals)
- LTV:CAC ratio calculations and payback period
- Trend analysis and forecasting by month/quarter
Key Features:
- Automated formulas and error checks to prevent double counting
- Visual dashboards for quick readouts in exec meetings
- Scenario planning (what happens if CPC rises 20%? if win rate improves 3%?)
- Benchmark comparisons so you can sanity-check performance
How to use it:
- Map every cost to a category; allocate shared costs (e.g., leadership time) by a rational driver.
- Split acquisition by channel and segment; calculate CAC and LTV for each slice.
- Review LTV:CAC and payback period monthly. Prioritize actions where payback > 12 months or LTV:CAC < 3:1.
Watch out for: Under-allocating overhead, ignoring sales engineering and onboarding, and counting expansion revenue without matching support costs.
Attribution Analysis Framework
A systematic approach to uncover which touchpoints and channels actually drive high-value customers—not just clicks.
Components:
- Multi-touch attribution modeling (time decay, position-based, data-driven)
- Channel contribution analysis (incrementality, not just last-click)
- Customer journey mapping to identify key moments
- ROI by touchpoint (content, campaigns, creative)
How to use it:
- Enforce UTMs and naming conventions everywhere.
- Compare model outputs with self-reported attribution in your demo/signup forms.
- Run holdout or geo-split tests to measure true incrementality.
- Shift budget toward touchpoints that lift opportunities and revenue, not vanity metrics.
Watch out for: Double counting across platforms and optimizing to MQLs that don’t convert to revenue.
Lead Scoring Model Template
A framework for effective lead scoring that surfaces sales-ready prospects and reduces CAC by improving conversion and cycle time.
Includes:
- Demographic criteria (industry, company size, role/title)
- Behavioral triggers (pricing visits, case study downloads, product usage)
- Negative scoring (career page visits, student emails, competitor domains)
- Score thresholds for MQL/SQL/SAL
How to use it:
- Start simple: a points-based model combining firmographic + behavioral data.
- Weight recent behavior higher than old activity.
- Validate monthly: if high-scored leads don’t convert better, recalibrate.
- Align SLAs with thresholds so sales responds fast to high-intent signals.
Watch out for: Over-indexing on content downloads and ignoring product-qualified behaviors.
Sales Process Optimization Checklist
A comprehensive checklist to find and fix process friction that inflates CAC.
Covers:
- Lead handoff procedures (ownership, timing, context)
- Follow-up cadences (multichannel, day 0–14)
- Sales stage definitions and exit criteria
- Conversion rate benchmarks and win-loss discipline
How to use it:
- Measure time-to-first-touch and touch density by rep and segment.
- Map stall points in your funnel; design plays to remove each friction.
- Standardize mutual close plans and objection handling.
- Review weekly in RevOps—optimize one bottleneck at a time.
Watch out for: “Black box” stages (e.g., “evaluation”) without clear exit criteria.
Channel Performance Dashboard
A template for always-on visibility across all acquisition channels.
Features:
- Channel-specific KPIs (CPC, CTR, SQL rate, win rate, CAC, payback)
- Cost per acquisition tracking by segment
- Conversion rate analysis by stage
- ROI calculations tied to revenue, not leads
How to use it:
1. Report weekly to spot early trend breaks.
- Tag tests and annotate changes (new creative, landing pages).
- Reallocate budget monthly from low-ROI to high-ROI channels.
Watch out for: Optimizing to lead volume instead of pipeline and revenue.
Customer Segmentation Analysis
A framework to identify your most profitable segments and point your budget where LTV:CAC is strongest.
Components:
- Segment definition (firmographics, technographics, use case)
- Profitability analysis (gross margin, onboarding cost, support intensity)
- CAC and LTV by segment with payback
- Targeting recommendations and creative angles
How to use it:
1. Rank segments by unit economics, not ACV alone.
- Build segment-specific messaging, offers, and landing pages.
- Shift spend to segments with sub-9-month payback or LTV:CAC ≥ 4:1.
Watch out for: Enterprise deals that look great on ACV but sink LTV:CAC with long cycles and customization.
Pricing Optimization Toolkit
Tools and frameworks to test and tune pricing for better unit economics and lower blended CAC.
Includes:
- Price sensitivity and willingness-to-pay analysis
- A/B testing frameworks (packaging, anchoring, trials)
- Value-based pricing models tied to outcomes
- Competitive analysis templates for positioning
How to use it:
- Test packaging and tiers before pure price changes.
- Use anchoring to steer buyers to the sweet spot.
- Measure impact on win rate, ACV, churn, and sales cycle.
4. Revisit pricing quarterly; market moves fast.
Watch out for: Discounting that spikes CAC by attracting poor-fit customers.
Advanced CAC Optimization Strategies
Once your foundations are solid, these advanced plays unlock step-change improvements. Treat them as force multipliers on top of your baseline work.
Predictive Lead Scoring
Move beyond basic rules to machine-learning models that surface the highest-value prospects.
Implementation Steps:
- Gather historical data on leads and outcomes (won/lost, ACV, cycle length).
- Identify patterns (content paths, firmographics, product usage) that predict conversion.
- Build models (e.g., inside your CRM/warehouse or with off-the-shelf tools).
- Deploy scores into routing and cadences; retrain monthly.
Expected Impact: 20–30% improvement in lead-to-opportunity conversion, reducing effective CAC and shortening sales cycles.
Watch out for: Models trained on biased data (e.g., past channel bias) that miss new, high-potential segments.
Account-Based Marketing (ABM)
For B2B SaaS targeting enterprise, ABM channels resources toward high-value accounts for outsized efficiency.
Key Components:
- Target account identification and research
- Personalized content and offers by account
- Multi-channel orchestration (email, ads, SDR, events)
- Account-level measurement and optimization
Expected Impact: 50–100% improvement in enterprise deal conversion rates; more pipeline from fewer, better-qualified accounts.
Watch out for: Spreading ABM too thin. Fewer accounts, deeper personalization, better results.
Customer Success-Driven Expansion
Lower blended CAC by growing revenue inside existing accounts—your cheapest path to growth.
Strategies:
- Proactive CS management with health scores and success plans
- Usage-based triggers that signal upsell readiness
- Structured cross-sell/upsell plays mapped to value moments
- Advocacy and referrals to fuel low-cost acquisition
Expected Impact: 30–50% reduction in blended CAC as NRR rises and expansion offsets new-logo costs.
Watch out for: Pushing upsells before value is realized; expansion follows outcomes, not pressure.
Marketing Mix Modeling
Use statistical modeling to understand true channel contribution (including offline and dark social) and optimize budget at the portfolio level.
Benefits:
- Reveal interactions and synergies across channels
- Optimize budget by diminishing returns curves
- Plan scenario-based budgets with confidence
Expected Impact: 15–25% improvement in overall marketing efficiency by reallocating spend to the highest incremental channels.
Watch out for: Treating MMM as a one-off. It’s a quarterly practice, not a report.
Measuring Success: KPIs and Benchmarks
Successful CAC optimization requires continuous measurement, clear ownership, and regular benchmarking against industry standards. Measure what matters, segment ruthlessly, and act on trends fast.
Principles that keep you honest
- Segment everything: By channel, campaign, persona, deal size (SMB/mid-market/enterprise), and motion (PLG vs SLG). A single “blended CAC” hides problems.
- Use gross-margin–adjusted metrics: CAC payback must be calculated on gross profit, not revenue.
- Mix leading + lagging indicators: Don’t wait for ARR to tell you a channel is failing—watch early-stage conversion and intent signals.
- Cohorts over snapshots: Compare this month’s leads through to win over time. Trends beat one-off numbers.
- Tie KPIs to actions: Every metric should trigger a decision, experiment, or budget reallocation.
Primary KPIs
Customer Acquisition Cost (CAC)
- Target: Varies by industry and customer segment.
- Benchmark: $299–$14,774 depending on industry and segment.
- Measurement frequency: Monthly (with weekly leading-indicator reviews).
Formula (fully loaded):
CAC = (Sales + Marketing + Tech + Overhead tied to acquisition) / New Customers
Include salaries, commissions, programs, tools, content, partners, onboarding-to-first-value, and a fair overhead allocation.
How to use it: Track CAC by channel and segment. Kill or fix outliers. Compare CAC against ARPA and gross margin to understand payback.
LTV:CAC Ratio
- Target: 3:1 minimum, 5:1 ideal
- Benchmark: 3:1–5:1 for healthy SaaS companies
- Measurement frequency: Quarterly (model updates monthly).
Formula (subscription simplifier):
LTV ≈ ARPA × Gross Margin % × (1 / Churn Rate)
For usage-based, model by cohort and expansion; include net revenue retention.
How to use it: Evaluate by segment. A flashy enterprise ACV with heavy customization can crater LTV:CAC. If LTV:CAC < 3:1, either reduce CAC or raise LTV (pricing, packaging, expansion, retention).
CAC Payback Period
- Target: ≤12 months.
- Benchmark: 10–15 months for most SaaS companies.
- Measurement frequency: Monthly (quarterly board view).
Formula:
Payback (months) = CAC / (ARPA × Gross Margin %)
Use net new gross profit per month. For enterprise, model ramp and implementation lags.
How to use it: Prioritize channels/segments with sub-9-month payback. Anything beyond 15 months deserves scrutiny or a strategic rationale.
Secondary KPIs
Lead Conversion Rates
- Target: 2–5% for paid traffic; 5–15% for organic.
- Varies significantly by industry and channel.
- Measurement frequency: Weekly.
Diagnostics:
- Below-target paid conversion? Tighten audience + offer + landing page.
- Organic lagging? Improve intent match, add proof, speed up page load, and fix information scent.
Sales Cycle Length
- Target: Varies by deal size and complexity.
- Benchmark: 30–90 days for SMB, 6–18 months for enterprise.
- Measurement frequency: Monthly.
Diagnostics:
- Map stall points by stage. Add mutual close plans. Provide self-serve education for complex steps. Shorten approvals. Remove custom work where possible.
Channel Performance
- Target: Positive ROI across all channels.
- Benchmark: Varies by channel and industry.
- Measurement frequency: Weekly.
Metrics to track by channel:
CPC/CPM → CTR → CVR to MQL/SQL → Win Rate → CAC → Payback → ROI. Annotate every meaningful change (new creative, pricing, LP).
Benchmarking Your Performance
Regular benchmarking helps you understand how your CAC performance compares to industry standards and pinpoint where to focus next.
Industry Benchmarks by Sector:
Industry
Small Business CAC
Mid-Market CAC
Enterprise CAC
Fintech
$1,461
$4,923
$14,774
Security
$833
$5,330
$10,226
Healthcare
$948
$4,357
$11,044
eCommerce
$299
$1,407
$2,206
Education
$849
$2,846
$6,682
Source: First Page Sage B2B SaaS Customer Acquisition Cost Report
Common Pitfalls and How to Avoid Them
Even with the best intentions, many companies make critical mistakes when trying to reduce CAC. Here are the most common pitfalls, how to spot them early, and what to do instead.
Pitfall 1: Focusing Only on Cost Reduction
The Mistake: Cutting marketing spend without considering the impact on lead quality and volume.
Why It Happens: Pressure to improve unit economics leads to knee-jerk cost cutting rather than strategic optimization.
Warning Signs:
- Lead volume drops faster than win rate improves; pipeline coverage sinks below 3×.
- CPL falls, but cost per qualified opportunity (CPQO) and CAC rise.
- Brand search, direct traffic, and share of voice decline.
- Sales cycle lengthens as higher-intent demand dries up.
How to Avoid It: Focus on efficiency improvements, not just expense cuts. Measure cost per qualified lead/opportunity and payback—not only cost per lead. Preserve high-intent and compounding channels (brand/SEO, community, referrals) while trimming low-incremental spend.
Quick Wins:
- Shift budget from broad, low-intent campaigns to bottom-of-funnel offers tied to revenue.
- Maintain a minimum brand baseline so remarketing and conversion don’t stall.
- Run incrementality tests/holdouts before cutting a channel entirely.
Pitfall 2: Over-Optimizing for Short-Term Metrics
The Mistake: Making changes that improve immediate CAC but hurt long-term customer value.
Why It Happens: Quarterly pressure and short-term thinking override long-term strategy.
Warning Signs:
- CAC improves, but LTV:CAC falls below 3:1; NRR flatlines.
- Early-term churn (0–90 days) spikes after aggressive discounts or frictionless trials.
- Price promotions lift signups but depress ARPA and lengthen payback.
How to Avoid It: Always consider the full lifecycle when optimizing. Track LTV, NRR, gross-margin-adjusted payback, and cohort retention alongside CAC. Implement quality gates (PQL thresholds, activation milestones) so volume doesn’t trump value.
Quick Wins:
- Replace blanket discounts with value-based trials tied to activation.
- Align comp to revenue quality (e.g., 90-day retained ARR), not first-month bookings.
- Add success playbooks to lift Day-30/Day-60 activation—CAC “improves” when retention rises.
Pitfall 3: Ignoring Channel Interactions
The Mistake: Optimizing channels in isolation without considering how they work together.
Why It Happens: Lack of proper attribution and the complexity of modern journeys.
Warning Signs:
- Cutting upper-funnel spend raises remarketing CAC.
- “Last-click hero” channels look great while total pipeline shrinks.
- Organic and direct traffic fall after paid awareness cuts.
How to Avoid It: Implement multi-touch attribution and consider channel synergies in decisions. Use marketing mix modeling (MMM) or simple geo/holdout tests to quantify incrementality. Optimize the portfolio, not just the parts.
Quick Wins:
- Keep a baseline awareness budget to feed mid/bottom-funnel.
- Tag and annotate campaigns; correlate brand search and direct traffic with media changes.
- Consolidate creative and messaging across channels for stronger information scent.
Pitfall 4: Not Testing Changes
The Mistake: Making large changes without proper testing and measurement.
Why It Happens: Impatience and overconfidence in optimization strategies.
Warning Signs:
- Big swings in performance with no experiment plan or control.
- Conflicting readouts across teams; seasonality mistaken for impact.
- “P-hacking” and post-hoc rationalization replace power calculations.
How to Avoid It: Always test changes with small segments before full rollout. Use pre-registered hypotheses, clear success metrics, and statistical significance (or sequential testing methods). Centralize an experiment registry so learnings compound.
Quick Wins:
- Ship with feature flags; ramp 10% → 25% → 50% → 100%.
- Standardize A/B templates (sample size, duration, success metric).
- Add calibration tests (e.g., known-good headline) to validate your testing rig.
Pitfall 5: Neglecting Customer Retention
The Mistake: Focusing entirely on acquisition while ignoring retention and expansion.
Why It Happens: Separate teams and metrics for acquisition and retention.
Warning Signs:
- NRR below 100% and rising GRR churn; expansion < 20% of growth.
- Sales wins “celebrated,” but cohorts decay in months.
- CAC payback stretches as ARPA and tenure decline.
How to Avoid It: Optimize for blended CAC that includes expansion revenue. Align acquisition and retention strategies: sell to the ICP you can activate, retain, and grow. Incentivize CS-driven expansion, referrals, and advocacy.
Quick Wins:
- Launch onboarding sprints to shorten time-to-value and cut early churn.
- Create upsell triggers (usage thresholds, outcomes achieved) with CS playbooks.
- Formalize advocacy/referral programs—your lowest-CAC channel.
The Future of Customer Acquisition
Understanding emerging trends in customer acquisition helps you prepare for future challenges and opportunities. The next wave favors teams that own their data, instrument their funnel, and design for compounding effects (community, product, and brand). Here’s what’s changing—and how you can stay ahead.
Trend 1: Privacy-First Marketing
With increasing privacy regulations and the deprecation of third-party cookies, customer acquisition is becoming more challenging and expensive.
Implications:
- First-party and zero-party data become more valuable (consented emails, in-product events, survey responses).
- Content marketing and owned media (newsletter, blog, podcast, community) gain importance as reliable, low-CAC channels.
- Attribution gets harder; last-click inflates “closer” channels while undercounting awareness and mid-funnel.
- Customer lifetime value (LTV) becomes more critical as acquisition becomes pricier; retention offsets CAC.
- Contextual and cohort-based targeting resurge as privacy-safe demand generators.
- Server-side tagging and consent management become table stakes for measurement resilience.
Preparation Strategies:
- Invest in first-party data collection (value exchanges: calculators, templates, gated tools) and progressive profiling to deepen context over time.
- Build owned media properties: editorial calendar, SEO moats, newsletter with clear POV, and community spaces (Slack/Discord).
- Develop privacy-compliant attribution: server-side tracking, modeled conversions, MMM/geo holdouts, and self-reported attribution in forms.
- Focus on customer retention and expansion to improve LTV:CAC; make NRR a north-star.
- Stand up data governance (consent logs, data lineage, retention policies) to reduce compliance risk and avoid data gaps.
KPIs & Guardrails:
- Consent opt-in rate, match rate, modeled vs observed conversions, brand search volume, organic traffic growth, payback.
- Guardrail: don’t starve awareness; maintain a baseline brand layer so mid-/bottom-funnel channels stay efficient.
Common Pitfall to Avoid: Slashing upper-funnel because it’s harder to attribute—then watching CAC climb as pipelines dry up.
Trend 2: AI-Powered Optimization
Artificial intelligence and machine learning are enabling more sophisticated optimization of customer acquisition efforts.
Applications:
- Predictive lead scoring and routing (PQL/SQL propensity, ACV likelihood, churn risk).
- Dynamic pricing and packaging experiments tied to value realization.
- Automated campaign optimization (budget pacing, bid strategies, creative iteration).
- Personalized experiences (in-app guidance, next-best action, website personalization by segment).
Implementation Considerations:
- Start simple: augment your rules-based scoring with a lightweight model before rolling out full ML.
- Ensure data quality and quantity: unified IDs, clean event schemas, deduped accounts/contacts.
- Maintain human oversight: experiment reviews, bias checks, and clear escalation paths.
- Continuously test and refine: compare model lift vs baseline; retrain monthly/quarterly as patterns shift.
- Put MLOps and governance in place (versioning, feature stores, audit trails) so models don’t become black boxes.
KPIs & Guardrails:
- Lift over baseline (precision/recall for high-intent cohorts), cycle-time reduction, win-rate delta, CAC and payback by modeled vs non-modeled cohorts.
- Guardrail: if lift isn’t statistically significant, roll back—don’t let AI entrench bad assumptions.
Common Pitfall to Avoid: Over-fitting to yesterday’s channels and creative. Your model should discover new pockets of intent, not ossify old ones.
Trend 3: Product-Led Growth
More SaaS companies are adopting product-led growth strategies that reduce reliance on traditional sales and marketing.
Characteristics:
- Freemium or free trials that deliver value fast (time-to-first-value under minutes, not weeks).
- Self-service onboarding with guided tours, checklists, and in-app education.
- In-product upgrade prompts at value moments (usage thresholds, feature unlocks).
- Viral product features (collaboration, sharing, integrations) that pull in new users.
Success Factors:
- Excellent user experience: clean IA, fast performance, accessible help, “success by default.”
- Clear value demonstration: an unmistakable “aha” moment tied to the core job-to-be-done.
- Frictionless onboarding: minimal fields, SSO/SAML, smart defaults, sample data.
- Strong product-market fit: the product solves a painful, frequent problem for a focused ICP.
- Hybrid motion readiness: PLG to land, sales-assist to expand into enterprise (security, procurement, multi-workspace).
Plays & KPIs:
- Track activation rate, PQL rate, PQL → opportunity → win, WAU/MAU, expansion % of NRR, self-serve CAC vs sales-led CAC.
- Add mutual success plans for sales-assist tiers; instrument time-to-value relentlessly.
Common Pitfall to Avoid: A generous free tier that cannibalizes paid without driving upgrade moments. Design the free experience to prove value, not replace it.
Trend 4: Community-Driven Acquisition
Building communities around products and brands is becoming an increasingly effective way to reduce acquisition costs.
Benefits:
- Lower cost per acquisition as peer recommendations outperform ads.
- Higher customer lifetime value through deeper engagement and shared learning.
- Stronger brand loyalty and resilience against competitors.
- Organic growth via word-of-mouth, UGC, and events.
Implementation Strategies:
- Create valuable content and resources (office hours, workshops, AMAs, templates).
- Foster user-generated content (playbooks, showcases, libraries of examples).
- Facilitate peer-to-peer connections (channels by role/vertical, local chapters, user groups).
- Provide exclusive community benefits (betas, roadmap input, certifications, recognition).
- Empower ambassadors and champions with toolkits, co-marketing, and light enablement.
KPIs & Guardrails:
- Referral rate, community-sourced pipeline/ARR, engagement depth (posts/member, event attendance), NPS, advocacy volume (reviews, case studies).
- Guardrail: community is a product, not just a channel—protect trust with clear moderation and transparent incentives.
Common Pitfall to Avoid: Treating community as a broadcast list. Communities thrive on participation, not announcements.
How Delverise Can Help
If diagnosing and fixing these hidden CAC drivers sounds daunting, you’re not alone. At Delverise, we help B2B SaaS companies build revenue engines that systematically reduce customer acquisition costs while scaling pipeline.
Our approach combines RevOps strategy, GTM engineering, and data-driven execution to identify the exact levers driving your CAC — and fix them. Whether you need to overhaul your attribution model, optimize your sales process, or build a content-led acquisition engine, we’ve helped companies cut CAC by 40–60% while growing pipeline.
Ready to stop bleeding money on inefficient acquisition? Reach out to Delverise about building a growth engine that actually scales.
Taking Action on Your CAC Crisis
Your customer acquisition cost is either your competitive advantage or your Achilles’ heel. Companies with efficient customer acquisition will thrive while those with bloated CACs will struggle to survive.
The 15 hidden reasons outlined in this article represent the most common and impactful issues that drive CAC through the roof. But knowledge without action is worthless. The companies that will succeed are those that systematically identify and fix these issues using the framework and strategies provided.
Your Next Steps
- Calculate your true CAC using the comprehensive formula that includes all hidden costs
- Audit your current state using the 15 hidden reasons as a diagnostic checklist
- Implement quick wins that can deliver immediate impact with minimal effort
- Develop a systematic optimization plan that addresses your highest-impact opportunities
- Measure and iterate continuously to ensure sustained improvement
The Cost of Inaction
Every day you delay addressing your CAC problems, you’re burning cash that could be invested in growth, product development, or building competitive moats. Companies that act quickly to optimize their customer acquisition will have significant advantages over those that wait.
Remember the case studies: HubSpot reduced CAC by 60% while growing revenue by 215%. Dropbox grew from 100,000 to 4 million users in 15 months through referrals. Airbnb achieved 50% CAC reduction and 10x revenue growth through SEO and social media.
These results aren’t accidents—they’re the outcome of systematic, strategic approaches to customer acquisition optimization.
The Opportunity Ahead
While rising CACs present challenges, they also create opportunities for companies that can acquire customers more efficiently than their competitors. In markets where average CACs are increasing, companies with optimized acquisition processes can gain significant market share advantages.
The strategies and frameworks in this article provide a roadmap for achieving these advantages. But success requires commitment, systematic execution, and continuous optimization.
Your unit economics are too important to leave to chance. Start optimizing your CAC today, and build the foundation for sustainable, profitable growth.
Related Articles
- Why Every Scaling Startup Needs RevOps
- How to Build a Go-to-Market Strategy
- Best Revenue Intelligence Platforms
- How to Create a Successful CRO Strategy
- Lead Generation Strategies for Startups