←Back to blog
Growth & Demand GenerationGuideMay 20, 202637 min read
The Complete B2B Sales Funnel Metrics Guide: 40+ KPIs That Actually Drive Revenue Growth in 2026
B2B sales funnel metrics have evolved beyond linear conversion rates. Master 40+ KPIs across attribution, velocity, and account-based engagement to drive 2026 revenue.
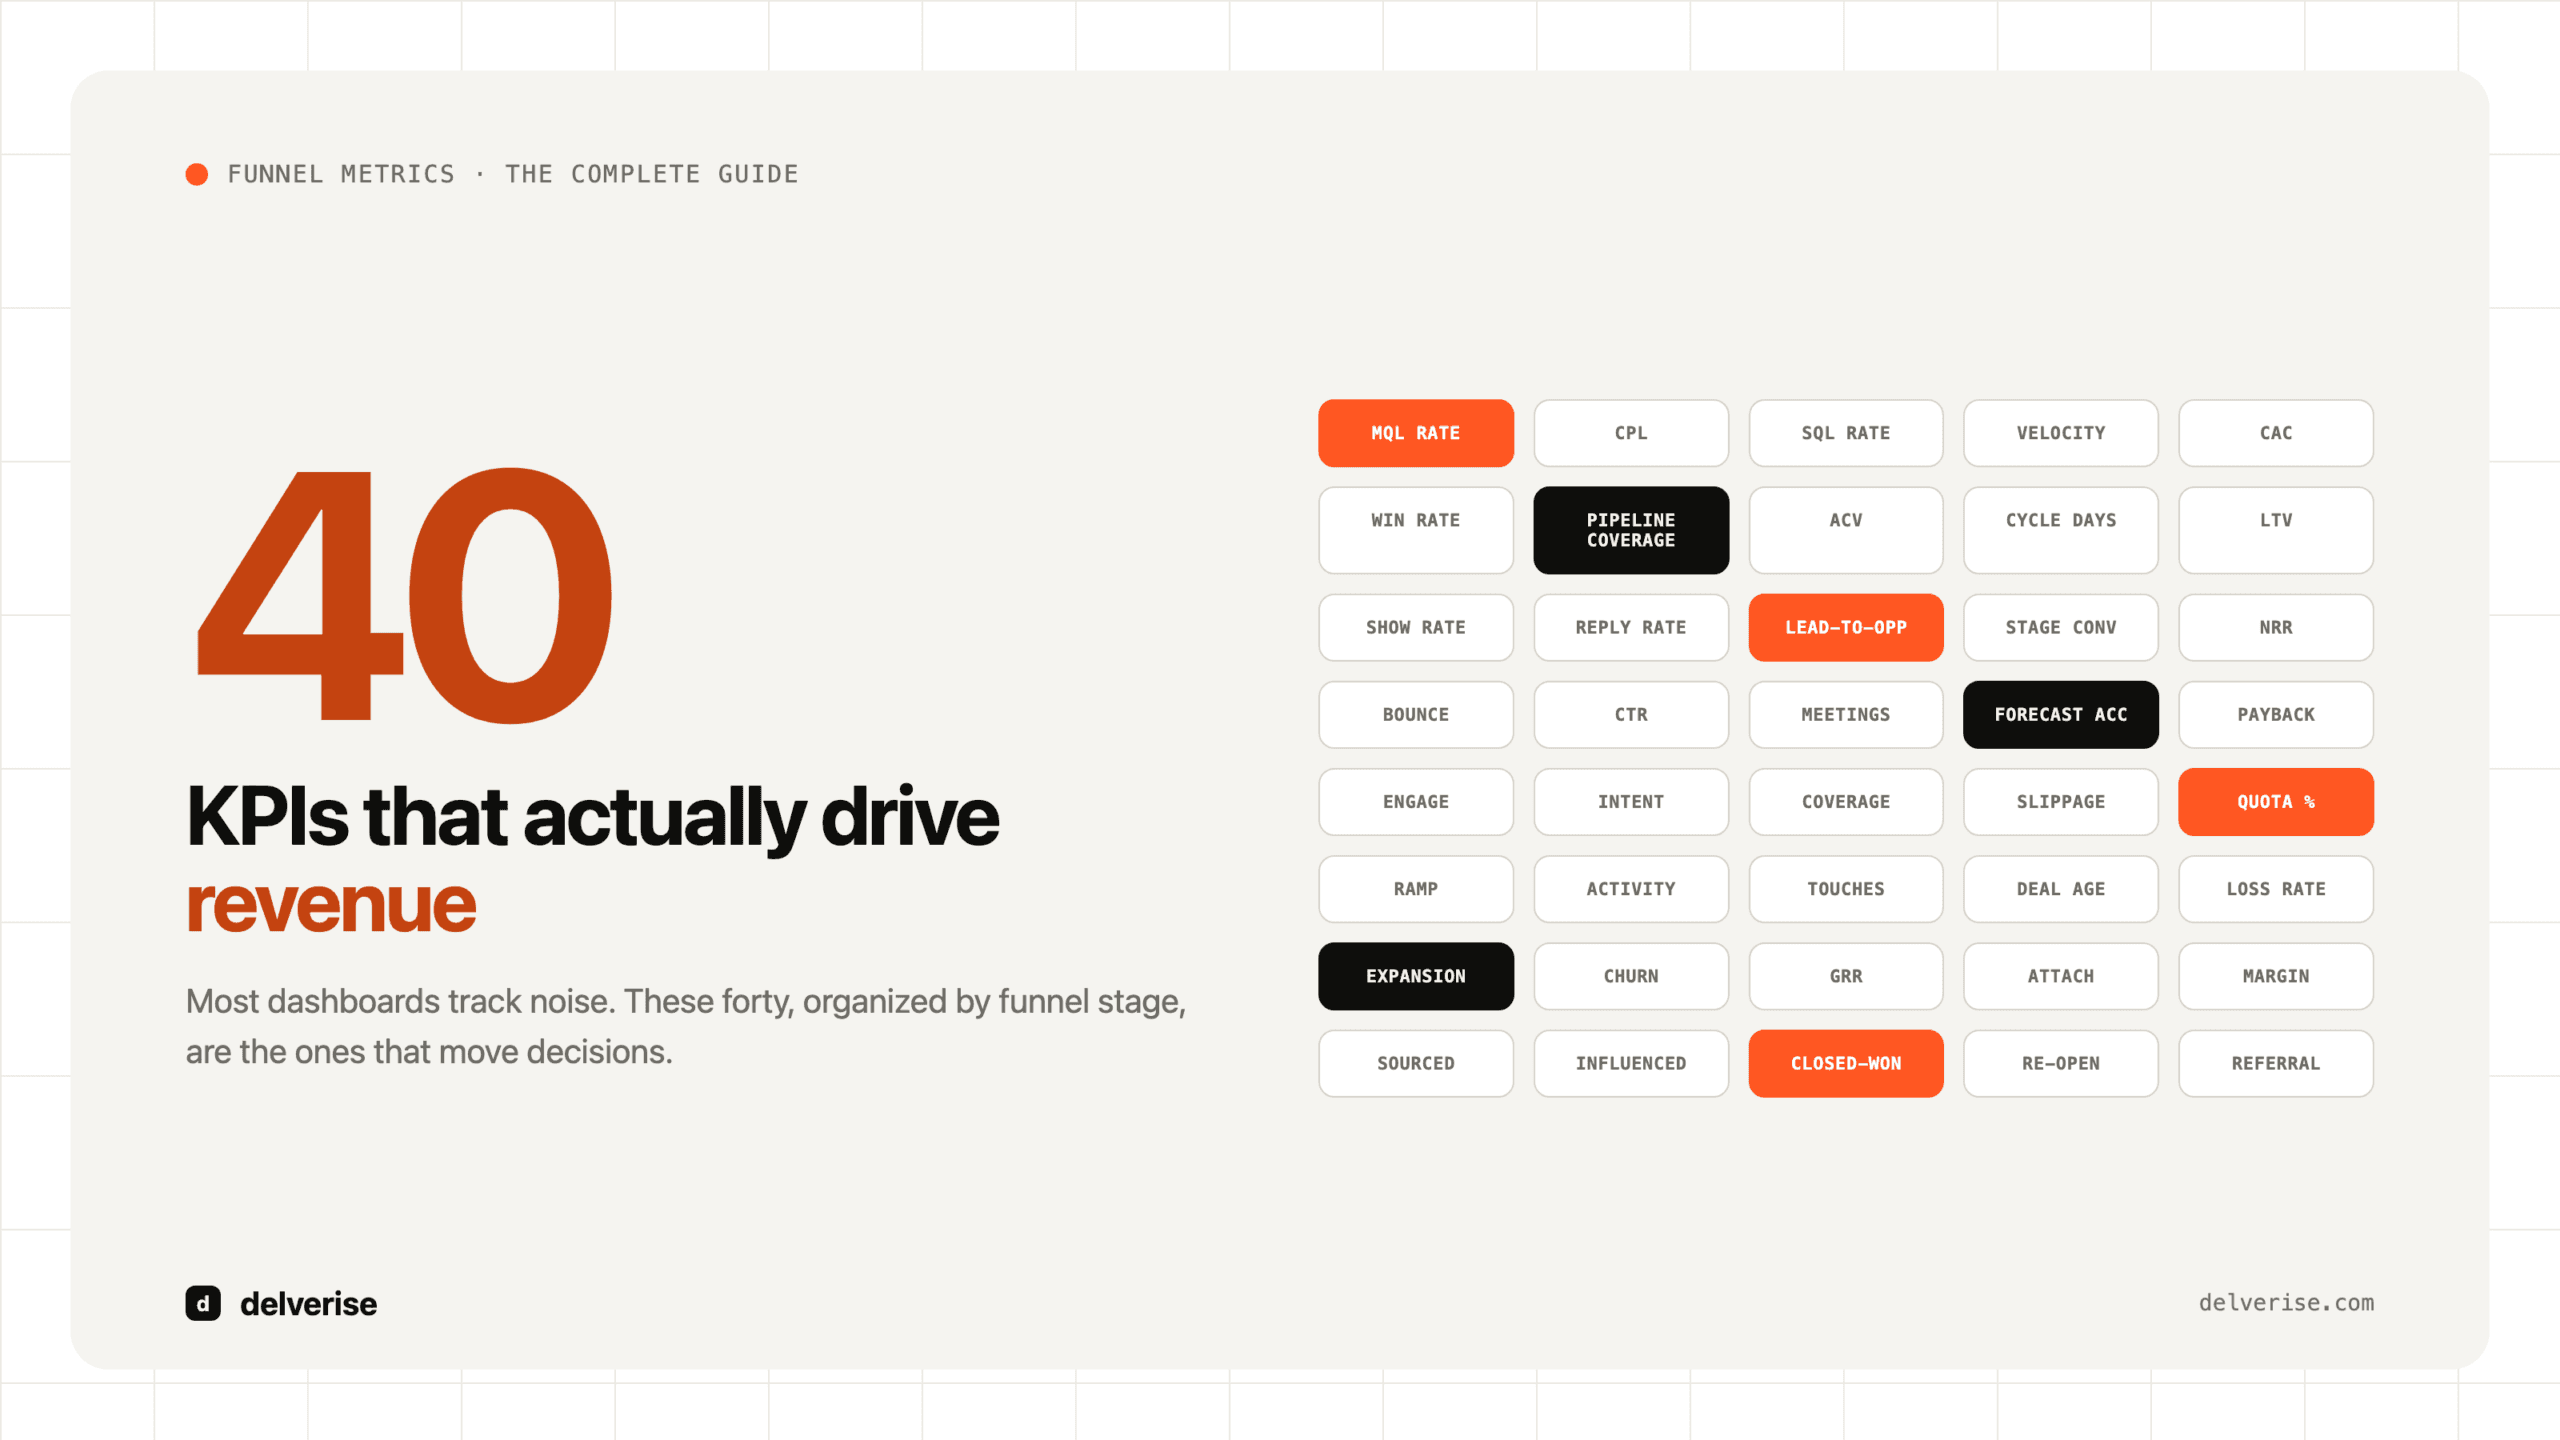
Answer: B2B sales funnel metrics only become useful when they connect acquisition, qualification, opportunity creation, deal movement, retention, and expansion into one operating model. Track the KPIs by funnel stage, but manage them as a system: top-of-funnel quality, middle-of-funnel qualification speed, bottom-of-funnel conversion, and post-sale revenue health all need to share the same CRM, enrichment, routing, and reporting logic.
- Use top-of-funnel metrics to understand whether demand is creating qualified accounts, not just more volume.
- Use middle-of-funnel metrics to identify where routing, scoring, or follow-up creates drag.
- Use bottom-of-funnel metrics to diagnose win rate, sales cycle, deal quality, and forecast reliability.
- Use post-sale metrics to connect retention, expansion, product adoption, and customer health back into the revenue motion.
The practical goal is not a longer KPI dashboard. It is a revenue system where the team can see what is happening, trust the data, and act before pipeline problems become missed revenue.
Foundation Framework: Why Traditional Funnel Metrics Fail in 2026
The B2B buyer journey has fundamentally changed, but most companies are still measuring success with metrics designed for a simpler era. Today’s B2B buyers don’t follow linear paths from awareness to purchase. Instead, they engage in complex, multi-stakeholder evaluation processes that span months or even years, involving multiple touchpoints across digital and offline channels.

Modern B2B sales cycles now average over 100 days, with 6-10 decision-makers typically involved in each purchase decision, and sometimes up to 20 stakeholders in complex enterprise deals. This reality renders traditional funnel metrics inadequate for three critical reasons.
The Complexity Challenge
Traditional funnel metrics assume a linear progression: visitor becomes lead, lead becomes opportunity, opportunity becomes customer. But modern B2B buyers jump between stages, re-enter the funnel multiple times, and influence each other through complex internal dynamics that simple conversion rates can’t capture.
Consider a typical enterprise software purchase. The initial visitor might be a mid-level manager researching solutions, but the actual decision involves IT leadership, procurement, finance, and C-level executives. Each stakeholder has different concerns, consumes different content, and influences the decision in unique ways. Traditional metrics like “lead conversion rate” miss this multi-dimensional reality entirely.
The Attribution Problem
Most B2B sales attribution models were designed for simpler buyer journeys with fewer touchpoints. Today’s prospects might engage with your content for months before ever talking to sales, consuming dozens of pieces of content across multiple channels. They might attend webinars, download whitepapers, engage on social media, visit your website multiple times, and interact with your sales team across various platforms.
Modern attribution modeling must account for this complexity, tracking first-touch and last-touch interactions along with the entire engagement journey across all stakeholders involved in the decision. This requires sophisticated metrics that can handle multi-touch, multi-stakeholder attribution across extended time periods.
The Quality vs. Quantity Shift
Traditional demand generation focused on volume: more leads, more opportunities, more activity. But as account-based marketing strategies show 76% higher ROI compared to other approaches, the focus has shifted dramatically toward quality and precision.
‘ABM delivers the highest return on investment of any B2B marketing strategy or tactic,’ notes the ITSMA/Momentum ABM Benchmark Study, with 87% of marketers reporting ABM outperforms other investments on ROI measurement. That is why delverise treats account penetration depth, not lead volume, as the leading indicator worth optimizing.
This shift demands entirely different metrics. Instead of measuring how many leads you generate, you need to measure how deeply you’re engaging target accounts. Instead of tracking opportunity volume, you need to understand opportunity quality and progression velocity. Instead of celebrating activity metrics, you need to focus on outcome-driven indicators that predict revenue.
The GTM Engineering Approach
The solution lies in what we call GTM Engineering: a systematic, data-driven approach to go-to-market operations that treats revenue generation as an engineering discipline. This methodology focuses on five key principles that transform how you think about metrics and measurement.
Principle 1: Systems Thinking Over Funnel Thinking
Rather than viewing your sales process as a linear funnel, GTM Engineering treats it as an interconnected system where every metric influences others. Win rate affects sales cycle length, which impacts pipeline coverage requirements, which influences lead generation targets. Understanding these relationships allows you to optimize the entire system rather than individual components.
Principle 2: Predictive Over Reactive Measurement
Traditional metrics tell you what happened. GTM Engineering metrics predict what will happen. Instead of just measuring closed revenue, you track leading indicators that predict future performance. Instead of reporting on past pipeline coverage, you forecast future coverage needs based on historical conversion patterns and current activity levels.
McKinsey research backs the shift toward predictive measurement: ‘Companies that use analytics to guide commercial decisions outperform peers by 5 to 8 percent in sales productivity and report 15 to 20 percent improvements in marketing ROI.’ delverise builds metric systems around leading indicators precisely because lagging revenue numbers arrive too late to change the outcome.
Principle 3: Account-Centric Over Lead-Centric Tracking
The shift from lead-based to account-based thinking requires fundamentally different metrics. Rather than tracking individual lead behavior, you measure account-level engagement across all stakeholders. Rather than optimizing for lead volume, you optimize for account penetration and multi-stakeholder engagement depth.
Principle 4: Automation-First Implementation
Manual metric tracking doesn’t scale and introduces errors that compound over time. GTM Engineering demands automated data collection, calculation, and reporting across all systems. This requires sophisticated tool integration and workflow automation that most companies haven’t implemented.
Principle 5: Continuous Optimization Culture
Metrics without action are meaningless. GTM Engineering creates feedback loops where metric insights drive immediate optimization actions, which generate new data, which drives further optimization. This creates a culture of continuous improvement rather than periodic reporting.
Tool Stack Integration Requirements
Implementing advanced B2B sales funnel metrics requires sophisticated tool integration that most companies underestimate. The modern GTM stack typically includes 15-20 different tools that must share data seamlessly to provide accurate, real-time metrics.

Your core infrastructure needs CRM systems like HubSpot or Salesforce integrated with data enrichment platforms like Clay, prospecting tools like Apollo, analytics platforms like GA4, and customer data platforms like Segment. Each integration point represents potential data quality issues that can corrupt your metrics.
The key is building what we call a “metrics-first architecture” where data quality and integration reliability take priority over feature richness. This means choosing tools based on their API quality and integration capabilities. Standalone functionality is a secondary consideration.
Top-of-Funnel Metrics: Advanced Acquisition and Awareness Tracking
Top-of-funnel metrics determine everything that happens downstream in your revenue engine. Get these wrong, and you’ll struggle with pipeline coverage, deal quality, and revenue predictability for months. The key is moving beyond basic traffic and conversion metrics to track sophisticated indicators that predict which prospects will actually become customers.
Modern top-of-funnel measurement requires understanding who visits your website, why they’re there, what they’re researching, and how their behavior patterns correlate with eventual purchase decisions. This section covers both foundational metrics every B2B company must track and advanced indicators that separate high-performing revenue teams from the competition.
1. Website Traffic by Source and Intent
Formula: Segmented traffic volume + Intent scoring + Source attribution
Traditional website traffic metrics focus purely on volume, but GTM Engineering demands understanding traffic quality and intent. This means tracking how many visitors you get from each source, what those visitors do, how they behave, and whether their behavior patterns match those of previous customers.
Modern B2B websites see 2-5% conversion rates, but this varies dramatically by traffic source and visitor intent. Organic search traffic from high-intent keywords converts at 3-7%, while social media traffic often converts below 1%. The key is building attribution models that connect traffic sources to eventual revenue outcomes.
Implementation with GA4 and RB2B: Set up enhanced ecommerce tracking in GA4 to capture detailed user journeys, then integrate with intent data platforms like RB2B to identify which companies are visiting your site and what they’re researching. This combination provides unprecedented visibility into top-of-funnel quality.
Advanced Optimization: Create dynamic content experiences based on traffic source and intent signals. Visitors from high-intent organic searches should see different messaging than those from social media or paid ads. This personalization can improve conversion rates by 15-25%.
2. Lead Conversion Rate by Channel
Formula: (New leads from channel / Total visitors from channel) × 100
Channel-specific conversion rates reveal which marketing investments actually drive qualified prospects. But advanced measurement goes beyond simple conversion percentages to understand conversion quality, lead scoring, and eventual revenue attribution.
Benchmark Insights: B2B SaaS companies typically see these conversion rates by channel:
– Organic search: 3-7%
– Paid search: 2-4%
– Content marketing: 1-3%
– Social media: 0.5-2%
– Email marketing: 5-15%
– Webinars/events: 10-25%
Clay Integration for Enhanced Tracking: Use Clay’s automated lead enrichment to append company and contact data to every lead immediately upon conversion. This enables real-time lead scoring and qualification that improves conversion quality measurement.
Advanced Implementation: Build conversion rate cohort analysis that tracks how conversion rates change over time and correlate with eventual deal outcomes. Leads that convert during certain periods or from specific campaigns often have different close rates and deal sizes.
3. Marketing Qualified Lead (MQL) Rate
Formula: (MQLs / Total leads) × 100
MQL rates measure how well your lead qualification process identifies genuine prospects versus casual browsers. Industry data shows only 1-2% of new prospects become MQLs, which actually indicates effective qualification rather than poor performance.
Advanced MQL Scoring: Modern MQL qualification uses behavioral scoring, demographic fit, and intent signals rather than simple form submissions. Prospects who visit pricing pages, download case studies, and engage with sales content score higher than those who only consume top-of-funnel educational content.
HubSpot Automation Setup: Configure lead scoring workflows that automatically adjust MQL thresholds based on historical conversion data. Leads that exhibit behaviors similar to previous customers get fast-tracked to sales, while others enter nurturing sequences.
Quality Optimization: Track MQL-to-SQL conversion rates by lead source and scoring criteria. This reveals which qualification criteria actually predict sales success versus those that just feel important.
4. Cost Per Lead (CPL) by Acquisition Channel
Formula: Total channel marketing spend / Number of leads generated
CPL measurement must account for both direct costs (ad spend, content creation) and indirect costs (team time, tool subscriptions, opportunity costs). Advanced CPL tracking also considers lead quality and eventual revenue attribution.
Channel-Specific Benchmarks:
– Paid search: $50-200 per lead
– Content marketing: $25-100 per lead
– Social media: $30-150 per lead
– Email marketing: $10-50 per lead
– Events/webinars: $100-500 per lead
Advanced Attribution: Don’t just track first-touch CPL. Use multi-touch attribution to understand how different channels work together to generate qualified leads. A prospect might discover you through content marketing, engage via social media, and convert through email marketing.
Apollo Integration: Use Apollo’s prospecting database to supplement inbound leads with targeted outbound prospecting, then track blended CPL across inbound and outbound channels.
5. Lead Response Time and Follow-up Velocity
Formula: Average time between lead creation and first meaningful contact
Lead response time dramatically impacts conversion rates, with optimal response times under 5 minutes. But advanced measurement tracks initial response time along with follow-up cadence, persistence, and multi-channel engagement.
Response Time Benchmarks:
– Under 5 minutes: 9x higher contact rates
– 5-10 minutes: 4x higher contact rates
– 10-30 minutes: 2x higher contact rates
– Over 30 minutes: Baseline performance
Automation Implementation: Set up instant lead alerts through Slack, SMS, and email. Configure round-robin assignment to ensure immediate response even when primary reps are unavailable. Use tools like Instantly.ai for automated follow-up sequences that maintain engagement.
Advanced Tracking: Measure first response time, time to meaningful conversation, time to qualification, and time to opportunity creation. These metrics reveal bottlenecks in your lead development process.
6. Content Engagement Scoring
Formula: Weighted engagement score based on content type, consumption depth, and recency
Content engagement scoring goes far beyond page views and download counts to understand which content actually influences purchase decisions. This requires tracking content consumption patterns, engagement depth, and correlation with eventual deal outcomes.
Advanced Content Attribution: Track which content pieces are consumed by prospects who eventually become customers, then weight your engagement scoring accordingly. A case study download might be worth 10 points, while a pricing page visit could be worth 25 points.
Implementation Strategy: Use marketing automation platforms to track content consumption across all channels, then feed this data into lead scoring models. Prospects who consume multiple pieces of content over time demonstrate higher purchase intent.
7. Intent Data Scoring (Advanced)
Formula: Composite score based on research behavior, competitive analysis, and buying signals
Intent data represents the next evolution in top-of-funnel measurement, identifying prospects who are actively researching solutions in your category before they ever engage with your company directly.
RB2B Implementation: RB2B’s intent data platform identifies which companies are visiting your website, what they’re researching, and how their behavior compares to known buyers. This enables proactive outreach to high-intent prospects.
Scoring Methodology: Weight intent signals based on historical correlation with deal outcomes. Companies researching competitor alternatives might score higher than those consuming general educational content.
8. Account-Based Marketing Engagement
Formula: (Engaged target accounts / Total target accounts) × 100
ABM engagement metrics track how effectively you’re penetrating target account lists with relevant, personalized content and experiences.
Multi-Stakeholder Tracking: Modern ABM measurement tracks engagement across all stakeholders within target accounts, including contacts beyond the primary ones. Use tools like Demandbase to identify and track multiple contacts within each target account.
9. Content Consumption Velocity
Formula: Average time between content touchpoints and content pieces consumed per session
Velocity metrics reveal how quickly prospects are moving through your content journey and how deeply they’re engaging with your educational materials.
Optimization Strategy: Prospects who consume content quickly often have higher purchase intent. Create fast-track nurturing sequences for high-velocity content consumers.
10. Lead Magnet Conversion Rates
Formula: (Downloads/registrations / Landing page visitors) × 100
Different lead magnets attract different quality prospects. Track conversion rates and eventual deal outcomes by lead magnet type to optimize your content strategy.
Quality Analysis: A whitepaper might generate more leads than a case study, but case study leads might convert to customers at higher rates. Track both volume and quality metrics for each lead magnet.
Middle-of-Funnel Metrics: Engagement and Qualification Mastery
Middle-of-funnel metrics determine whether your lead generation efforts translate into qualified sales opportunities. This is where deals are won or lost, often without sales teams realizing it. The key is tracking conversion rates between stages along with the quality of engagement, speed of progression, and predictive indicators that separate future customers from prospects who will never buy.

Modern middle-funnel measurement requires understanding multi-stakeholder engagement patterns, behavioral signals that predict purchase intent, and the complex qualification processes that determine whether prospects become legitimate opportunities. This section covers both essential conversion metrics and advanced engagement indicators that drive revenue predictability.
11. SQL Conversion Rate with Advanced Qualification
Formula: (SQLs / Total leads) × 100, segmented by qualification criteria
SQL conversion rates reveal the overall quality of your lead generation and nurturing processes. B2B SaaS companies typically see 5-15% SQL conversion rates, but this varies dramatically based on lead source, qualification criteria, and market conditions.
Advanced Qualification Framework: Move beyond basic BANT (Budget, Authority, Need, Timeline) criteria to include behavioral signals, engagement depth, and competitive displacement opportunities. Modern qualification considers factors like content consumption patterns, stakeholder engagement breadth, and intent signal strength.
Clay Prospecting Integration: Use Clay’s automated prospecting workflows to enrich leads with company data, competitive intelligence, and stakeholder mapping before qualification. This enables more sophisticated qualification decisions and improves SQL quality.
Optimization Strategy: Track SQL conversion rates by lead source and qualification criteria to identify which sources produce the highest-quality prospects. Leads from certain sources might convert at lower rates but close at higher percentages, making them more valuable despite lower conversion metrics.
12. Lead Velocity Through Qualification Stages
Formula: Average days between stage transitions + Stage-specific conversion rates
Lead velocity metrics reveal bottlenecks in your qualification process and predict future pipeline coverage. Faster-moving leads often indicate higher purchase intent, while stalled prospects might need different nurturing approaches.
Stage Velocity Benchmarks:
– Lead to MQL: 1-7 days (automated scoring)
– MQL to SQL: 5-14 days (sales qualification)
– SQL to Opportunity: 7-21 days (needs assessment)
– Opportunity to Proposal: 14-45 days (solution development)
Advanced Tracking: Measure velocity by lead characteristics (company size, industry, source) to identify patterns that predict faster progression. Enterprise leads might move slower but close larger deals, while SMB leads might progress quickly but require different sales approaches.
HubSpot Workflow Automation: Configure automated workflows that track stage progression and alert sales reps when leads stall in specific stages. Set up escalation processes for high-value prospects who haven’t progressed within expected timeframes.
13. SQL to Opportunity Conversion Optimization
Formula: (Opportunities created / SQLs) × 100
This metric reveals how effectively your sales team converts qualified leads into legitimate opportunities. Industry benchmarks show 20-40% SQL-to-opportunity conversion rates, but high-performing teams achieve 50%+ through superior qualification and needs assessment processes.
Conversion Quality Analysis: Track opportunity quality metrics like deal size, close probability, and sales cycle length, along with conversion percentages. Some sales reps might convert more SQLs to opportunities but create lower-quality deals that rarely close.
Advanced Implementation: Use conversation intelligence tools to analyze SQL qualification calls and identify patterns that predict successful opportunity creation. Reps who ask specific questions or uncover particular pain points might achieve higher conversion rates.
Apollo CRM Integration: Leverage Apollo’s sales intelligence features to provide sales reps with detailed prospect research before qualification calls. Better preparation leads to more effective qualification conversations and higher conversion rates.
14. Engagement Scoring with Behavioral Triggers
Formula: Weighted engagement score based on activity type, frequency, and recency
Engagement scoring goes beyond simple activity tracking to understand which behaviors actually predict purchase intent. This requires sophisticated scoring models that weight different activities based on their correlation with eventual deal outcomes.
Advanced Scoring Methodology:
– Pricing page visits: 25 points
– Case study downloads: 20 points
– Demo requests: 50 points
– Competitor comparison research: 30 points
– Multiple stakeholder engagement: 40 points
Behavioral Trigger Implementation: Set up automated alerts when prospects exhibit high-intent behaviors like visiting pricing pages multiple times, downloading case studies, or engaging with sales-focused content. These triggers enable timely sales outreach when prospects are most receptive.
Multi-Channel Tracking: Track engagement across all touchpoints including website visits, email interactions, social media engagement, and content consumption. Use marketing automation platforms to create unified engagement profiles for each prospect.
15. SDR Activity Metrics and Conversation Rates
Formula: Activities per day + Contact rates + Conversation rates + Meeting booking rates
SDR metrics must balance activity volume with outcome quality. High activity levels mean nothing if they don’t generate qualified conversations and booked meetings.
Activity Benchmarks for High-Performing SDRs:
– Calls per day: 50-80
– Emails per day: 30-50
– Social touches per day: 10-20
– Contact rate: 15-25%
– Conversation rate: 3-7%
– Meeting booking rate: 1-3%
Quality vs. Quantity Optimization: Track conversation quality metrics like average call duration, follow-up meeting rates, and eventual opportunity creation. SDRs who have longer conversations often book higher-quality meetings that convert to opportunities at higher rates.
Smartlead and Instantly Integration: Use tools like Smartlead and Instantly.ai to automate email sequences while maintaining personalization. Track response rates and meeting booking rates by sequence type and messaging approach.
16. Demo Conversion and Next-Step Scheduling
Formula: (Demos scheduled / Demo requests) × 100 + (Next meetings scheduled / Demos completed) × 100
Demo metrics reveal how effectively your sales team converts interest into progression. B2B demo no-show rates average 20-30%, making demo completion and follow-up scheduling critical metrics.
Demo Quality Indicators:
– Demo attendance rate: 70-80%
– Demo completion rate: 85-95%
– Next meeting scheduling rate: 60-80%
– Demo-to-opportunity conversion: 40-60%
Advanced Demo Tracking: Measure demo engagement metrics like questions asked, features explored, and stakeholder participation. Demos with multiple attendees and high engagement typically convert to opportunities at higher rates.
Optimization Strategy: Create demo follow-up sequences that automatically schedule next steps based on demo outcomes. Use demo recordings and engagement data to personalize follow-up messaging and proposals.
17. Multi-Stakeholder Engagement Tracking
Formula: (Accounts with multiple engaged stakeholders / Total engaged accounts) × 100

Modern B2B purchases involve 6-10 decision-makers, making multi-stakeholder engagement essential for deal progression. This metric tracks how effectively you’re building relationships across buying committees.
Stakeholder Mapping: Identify and track engagement with different stakeholder types including economic buyers, technical evaluators, end users, and influencers. Each stakeholder type requires different content and engagement approaches.
Advanced Implementation: Use account-based marketing platforms to track stakeholder engagement across all touchpoints. Create stakeholder-specific content journeys that address unique concerns and decision criteria for each role.
18. Deal Progression Velocity by Segment
Formula: Average days in each stage, segmented by deal characteristics
Deal velocity varies significantly by company size, industry, and deal complexity. Tracking velocity by segment enables more accurate forecasting and identifies optimization opportunities for different deal types.
Segment-Specific Benchmarks:
– SMB deals: 30-60 days average cycle
– Mid-market deals: 60-120 days average cycle
– Enterprise deals: 120-300 days average cycle
Velocity Optimization: Identify stages where deals consistently stall and implement specific interventions. Enterprise deals might stall during legal review, while SMB deals might stall during technical evaluation.
19. Competitive Win/Loss Analysis
Formula: (Wins against specific competitors / Total competitive deals) × 100
Competitive analysis reveals market positioning effectiveness and identifies improvement opportunities. Track win rates against specific competitors and analyze why deals are won or lost.
Advanced Competitive Intelligence: Use tools like Klenty or Outreach to track competitive mentions in sales conversations. Analyze win/loss patterns to identify competitive advantages and vulnerabilities.
Implementation Strategy: Create competitive battle cards and track their usage impact on win rates. Sales reps equipped with specific competitive intelligence often achieve higher win rates in competitive deals.
20. Proposal-to-Close Conversion Rates
Formula: (Closed won deals / Proposals sent) × 100
Proposal conversion rates reveal the quality of your sales process and solution fit. High-performing sales teams achieve 25-40% proposal-to-close conversion rates through superior qualification and solution development.
Proposal Quality Metrics:
– Time from proposal to response: 5-14 days
– Proposal revision requests: 20-40% of deals
– Proposal-to-close conversion: 25-40%
– Average proposal value: Varies by market
Optimization Approach: Analyze won and lost proposals to identify patterns that predict success. Proposals that address specific business outcomes and include detailed ROI calculations often convert at higher rates.
Bottom-of-Funnel Metrics: Revenue Generation and Deal Optimization
Bottom-of-funnel metrics determine whether all your marketing and sales efforts translate into actual revenue. These metrics reveal the ultimate effectiveness of your entire go-to-market strategy and provide the clearest indicators of business health and growth potential.
The key to bottom-funnel measurement lies in understanding what closes, why deals close, how quickly they progress, and which factors predict successful outcomes. This requires sophisticated analysis of win rates, deal characteristics, competitive dynamics, and the complex factors that influence purchase decisions.
21. Win Rate Analysis by Segment and Source
Formula: (Deals won / Total closed deals) × 100, segmented by relevant characteristics
Win rates typically range from 20-30% for most B2B sales teams, but this varies dramatically by deal size, source, industry, and competitive landscape. Advanced win rate analysis reveals which types of deals you’re most likely to close and why.
Segmentation Analysis:
– By deal size: Small deals (under $10K) often have 40-60% win rates, while enterprise deals (over $100K) might have 15-25% win rates
– By lead source: Inbound leads typically convert at 25-35%, while outbound prospects might convert at 15-25%
– By industry: Win rates vary significantly by vertical based on market maturity and competitive intensity
– By sales rep: Top performers often achieve 35-50% win rates while average reps achieve 20-30%
Advanced Implementation: Use CRM data to build predictive models that identify deal characteristics most likely to result in wins. Factors like stakeholder engagement, demo attendance, and competitive presence all influence win probability.
Optimization Strategy: Focus on deal types and sources that generate the highest win rates while maintaining acceptable deal sizes and sales cycle lengths. Sometimes lower-volume, higher-conversion sources provide better ROI than high-volume, low-conversion channels.
22. Average Deal Size Optimization Strategies
Formula: Total revenue / Number of deals closed
Average deal size directly impacts revenue efficiency and growth potential. Increasing average deal size by 10% can improve revenue by 10% without additional customer acquisition costs.
Deal Size Benchmarks by Market:
– SMB software: $5K-25K average deal size
– Mid-market software: $25K-100K average deal size
– Enterprise software: $100K-500K+ average deal size
Upselling and Cross-selling Metrics: Track expansion opportunities within existing deals and measure success rates for different upselling approaches. Deals that include multiple products or longer contract terms often have higher customer lifetime value.
Advanced Analysis: Analyze deal size distribution to identify opportunities for packaging optimization. Sometimes bundling services or extending contract terms can significantly increase deal values without proportionally increasing sales effort.
23. Sales Cycle Length Reduction Techniques
Formula: Average days from opportunity creation to close, segmented by deal characteristics
B2B sales cycles average 3-6 months, but cycle length varies significantly by deal size, complexity, and buying process maturity. Reducing sales cycle length improves cash flow, forecast accuracy, and sales team productivity.
Cycle Length Optimization Factors:
– Clear buying process documentation reduces cycles by 15-25%
– Multiple stakeholder engagement early in the process reduces cycles by 20-30%
– Competitive differentiation clarity reduces cycles by 10-20%
– ROI and business case development reduces cycles by 15-25%
Implementation Strategy: Map your sales process against typical buyer journeys and identify stages where deals consistently stall. Common bottlenecks include legal review, technical evaluation, and budget approval processes.
Advanced Tracking: Measure cycle length by deal characteristics to identify patterns. Enterprise deals might have longer cycles but higher values, while SMB deals might close quickly but require different sales approaches.
24. Proposal Conversion Rates
Formula: (Closed won deals / Proposals sent) × 100
Proposal conversion rates reveal the quality of your qualification process and solution development capabilities. High-performing sales teams achieve 25-40% proposal conversion rates.
Proposal Quality Indicators:
– Customization level: Highly customized proposals convert at 35-50% vs. 15-25% for generic proposals
– Business case inclusion: Proposals with detailed ROI analysis convert at 40-60% vs. 20-30% without
– Stakeholder alignment: Proposals addressing multiple stakeholder needs convert at higher rates
Optimization Approach: Analyze won and lost proposals to identify success patterns. Winning proposals often include specific business outcomes, detailed implementation timelines, and clear ROI calculations.
25. Forecast Accuracy Improvement
Formula: [1 – |Forecasted sales – Actual sales| ÷ Actual sales] × 100
Forecast accuracy benchmarks show 90%+ accuracy for high-performing teams. Accurate forecasting enables better resource planning, investor communication, and strategic decision-making.
Forecast Accuracy Factors:
– Deal stage definitions: Clear, objective stage criteria improve accuracy by 20-30%
– Historical data analysis: Using past performance patterns improves accuracy by 15-25%
– Pipeline coverage: Maintaining 3-4x pipeline coverage improves forecast reliability
– Regular pipeline reviews: Weekly pipeline reviews improve accuracy by 10-20%
Advanced Implementation: Build predictive models using historical deal data, current pipeline characteristics, and external factors like seasonality and market conditions.
26. Revenue Attribution Modeling
Formula: Revenue attributed to each marketing and sales touchpoint based on influence and timing
Revenue attribution reveals which activities actually drive closed deals versus those that just correlate with success. This requires sophisticated multi-touch attribution models that account for the complex B2B buyer journey.
Attribution Model Types:
– First-touch attribution: Credits the initial interaction
– Last-touch attribution: Credits the final interaction before close
– Multi-touch attribution: Distributes credit across all touchpoints
– Time-decay attribution: Weights recent interactions more heavily
Implementation Strategy: Use marketing automation platforms and CRM systems to track all prospect interactions, then build attribution models that reflect your specific buyer journey patterns.
27. Competitive Displacement Rates
Formula: (Deals won against specific competitors / Total competitive deals) × 100
Competitive displacement metrics reveal market positioning effectiveness and identify areas for improvement in competitive situations.
Competitive Analysis Framework:
– Win rates by competitor: Track performance against each major competitor
– Displacement strategies: Analyze successful competitive displacement tactics
– Competitive intelligence: Monitor competitor pricing, positioning, and feature changes
– Battle card effectiveness: Measure impact of competitive sales tools
Optimization Approach: Create competitor-specific sales strategies and track their effectiveness. Different competitors require different displacement approaches based on their strengths and weaknesses.
28. Price Sensitivity Analysis
Formula: Win rate correlation with pricing levels and discount percentages
Price sensitivity analysis reveals optimal pricing strategies and discount policies that maximize both win rates and deal values.
Pricing Optimization Metrics:
– Win rate by price point: Identify pricing sweet spots for different market segments
– Discount impact: Measure how discounting affects win rates and deal progression
– Competitive pricing analysis: Track win rates when priced above, at, or below competitors
– Value-based pricing success: Measure effectiveness of outcome-based pricing models
Advanced Implementation: Use A/B testing for pricing strategies and track long-term customer success metrics to ensure pricing optimization doesn’t compromise customer satisfaction.
29. Contract Negotiation Cycle Time
Formula: Average days from proposal acceptance to signed contract
Contract negotiation often represents a significant portion of the sales cycle, especially for enterprise deals. Optimizing negotiation processes can significantly reduce overall cycle times.
Negotiation Optimization Factors:
– Standard contract templates reduce negotiation time by 30-50%
– Legal team involvement early in the process reduces delays by 20-30%
– Clear pricing and terms documentation reduces back-and-forth by 25-40%
– Executive sponsor engagement accelerates approvals by 15-25%
30. Implementation Timeline Impact on Closure
Formula: Win rate correlation with proposed implementation timelines and complexity
Implementation timeline concerns often influence purchase decisions, especially for complex enterprise software. Understanding this relationship enables better solution positioning.
Implementation Impact Analysis:
– Timeline expectations: Longer implementation timelines might reduce win rates but increase deal sizes
– Resource requirements: Solutions requiring significant customer resources might need different positioning
– Success metrics: Clear implementation success criteria improve win rates and customer satisfaction
Post-Sale Revenue Metrics: Customer Success and Expansion Optimization
Post-sale metrics determine the long-term value and sustainability of your revenue growth. A 5% improvement in customer retention can more than double revenue, making post-sale optimization often more impactful than new customer acquisition.
Modern B2B success requires shifting from a transaction-focused mindset to a relationship-focused approach where initial sales represent the beginning of long-term revenue relationships. This section covers the critical metrics that predict customer success, identify expansion opportunities, and prevent churn before it happens.
31. Customer Lifetime Value (CLV) Calculation and Optimization
Formula: (Average monthly revenue per customer × Gross margin %) ÷ Monthly churn rate
CLV represents the total revenue a customer will generate over their entire relationship with your company. B2B SaaS companies typically see CLV:CAC ratios of 3:1 to 5:1, with higher ratios indicating more efficient growth.
Advanced CLV Modeling:
– Cohort-based analysis: Track CLV by customer acquisition period to identify trends
– Segment-based calculation: Different customer segments often have dramatically different CLV profiles
– Predictive modeling: Use early engagement metrics to predict long-term CLV
Optimization Strategies: Focus on customer segments and acquisition channels that generate the highest CLV. Sometimes lower-volume, higher-value segments provide better long-term returns than high-volume, low-value customers.
Implementation with HubSpot: Configure automated CLV calculations that update based on actual customer behavior, contract values, and retention patterns. Use this data to inform customer success priorities and expansion strategies.
32. Net Revenue Retention (NRR) Optimization
Formula: (Starting revenue + Expansion revenue – Churned revenue) ÷ Starting revenue × 100
NRR above 110% indicates strong product-market fit and expansion potential. Best-in-class B2B SaaS companies achieve NRR rates of 120-130% or higher.
NRR Component Analysis:
– Expansion revenue: Upsells, cross-sells, and usage-based growth
– Contraction revenue: Downgrades and reduced usage
– Churn revenue: Complete customer losses
Advanced Tracking: Measure NRR by customer segment, acquisition source, and time period to identify patterns and optimization opportunities. Enterprise customers might have higher NRR than SMB customers due to expansion potential.
Optimization Framework: Build systematic processes for identifying expansion opportunities, preventing downgrades, and reducing churn. Use customer health scores to prioritize intervention efforts.
33. Expansion Revenue Opportunities
Formula: (Expansion revenue / Total recurring revenue) × 100
Expansion revenue often provides the highest-margin growth opportunities since existing customers have lower acquisition costs and higher trust levels.
Expansion Revenue Types:
– Seat-based expansion: Adding more users or licenses
– Feature-based expansion: Upgrading to higher-tier plans
– Usage-based expansion: Growth in consumption-based pricing
– Cross-selling: Adding complementary products or services
Identification Strategies: Use product usage data, customer success interactions, and business growth indicators to identify expansion opportunities. Customers showing increased engagement or business growth often represent expansion prospects.
Timing Optimization: Track the optimal timing for expansion conversations based on customer lifecycle stage, usage patterns, and business outcomes achievement.
34. Churn Prediction and Prevention
Formula: (Customers lost / Total customers at start of period) × 100
B2B SaaS churn rates typically range from 5-15% annually, with lower churn rates indicating stronger product-market fit and customer success processes.
Churn Prediction Indicators:
– Declining product usage: 40-60% reduction in activity often predicts churn
– Support ticket patterns: Increased complaints or unresolved issues
– Engagement metrics: Reduced login frequency or feature usage
– Business changes: Leadership changes, budget cuts, or strategic shifts
Prevention Strategies: Implement early warning systems that identify at-risk customers before they decide to churn. Proactive intervention often prevents 30-50% of potential churn.
Advanced Implementation: Build predictive churn models using machine learning algorithms that analyze usage patterns, support interactions, and business characteristics to identify at-risk customers.
35. Customer Health Scoring
Formula: Weighted composite score based on usage, engagement, support, and business metrics
Customer health scores provide early indicators of satisfaction, expansion potential, and churn risk. Effective health scoring enables proactive customer success management.
Health Score Components:
– Product usage metrics: Login frequency, feature adoption, data volume
– Engagement metrics: Training completion, community participation, support interactions
– Business metrics: Goal achievement, ROI realization, stakeholder satisfaction
– Relationship metrics: Executive engagement, renewal discussions, reference willingness
Implementation Strategy: Weight health score components based on their correlation with actual customer outcomes. Usage metrics might be more predictive for some products, while engagement metrics might be more important for others.
36. Product Adoption Velocity
Formula: Time to achieve key usage milestones and feature adoption rates
Product adoption velocity predicts long-term customer success and expansion potential. Customers who adopt core features quickly often have higher retention rates and expansion revenue.
Adoption Milestones:
– Time to first value: How quickly customers achieve initial success
– Feature adoption rate: Percentage of available features actively used
– Advanced feature usage: Adoption of sophisticated capabilities
– Integration completion: Connection with other business systems
Optimization Approach: Create onboarding processes that accelerate adoption of high-value features. Use in-app guidance and customer success touchpoints to drive feature discovery and usage.
37. Support Ticket Correlation with Churn
Formula: Churn rate correlation with support ticket volume, type, and resolution time
Support interactions often provide early indicators of customer satisfaction and churn risk. Analyzing support patterns enables proactive intervention.
Support Correlation Analysis:
– Ticket volume trends: Increasing ticket volume often predicts churn
– Resolution time impact: Slow resolution times correlate with higher churn rates
– Ticket type analysis: Certain issue types might be more predictive of churn
– Escalation patterns: Executive escalations often indicate serious satisfaction issues
Prevention Strategy: Implement support ticket scoring that identifies high-risk patterns and triggers customer success intervention.
38. Renewal Probability Scoring
Formula: Predictive score based on usage, engagement, satisfaction, and business metrics
Renewal probability scoring enables proactive renewal management and resource allocation for customer success teams.
Scoring Components:
– Contract characteristics: Term length, pricing, and commitment level
– Usage patterns: Consistent usage indicates higher renewal likelihood
– Satisfaction metrics: NPS scores, survey responses, and feedback
– Business outcomes: Goal achievement and ROI realization
Implementation Framework: Build renewal probability models that update continuously based on customer behavior and enable early intervention for at-risk renewals.
39. Upsell Timing Optimization
Formula: Optimal timing analysis based on customer lifecycle stage, usage patterns, and business outcomes
Timing significantly impacts upsell success rates. Understanding optimal timing patterns enables more effective expansion strategies.
Timing Factors:
– Usage growth patterns: Customers approaching usage limits represent expansion opportunities
– Business milestones: Company growth or new initiatives create expansion needs
– Satisfaction peaks: High satisfaction periods provide optimal upsell timing
– Contract renewal periods: Renewal discussions often include expansion conversations
Optimization Strategy: Create systematic processes for identifying and acting on optimal upsell timing based on customer-specific indicators and historical success patterns.
Technology Stack & Implementation: Building Your Metrics Infrastructure
Implementing advanced B2B sales funnel metrics requires sophisticated technology infrastructure that most companies underestimate. The difference between companies that successfully implement comprehensive metrics tracking and those that struggle lies in their approach to tool selection, integration architecture, and automation workflows.
This section provides specific implementation guidance for building a metrics-first technology stack that delivers accurate, real-time insights across your entire revenue operation.
CRM Integration Framework
Your CRM system serves as the central hub for all sales funnel metrics, making its configuration and integration capabilities critical for success.
HubSpot Implementation Strategy
HubSpot’s comprehensive CRM platform provides robust metrics tracking capabilities when properly configured. Key implementation steps include:
Configure custom properties for advanced lead scoring that incorporates behavioral signals, demographic fit, and intent data. Set up automated workflows that update lead scores based on website activity, content consumption, and engagement patterns.
Implement deal stage automation that moves opportunities through your pipeline based on specific criteria rather than manual updates. This ensures consistent stage definitions and improves forecast accuracy.
Create custom dashboards that display real-time metrics for each funnel stage, with drill-down capabilities that reveal underlying data and trends. Use HubSpot’s reporting tools to build cohort analyses and trend reports.
Salesforce Advanced Configuration
For enterprise organizations requiring more sophisticated customization, Salesforce provides extensive metrics tracking capabilities. Advanced implementation includes:
Build custom objects and fields that capture unique business metrics not available in standard configurations. This might include competitive intelligence, stakeholder mapping, and advanced qualification criteria.
Implement Einstein Analytics for predictive scoring and advanced reporting capabilities. Use machine learning algorithms to identify patterns in your sales data that predict successful outcomes.
Configure territory management and role-based access controls that ensure data quality while providing appropriate visibility for different team members.
Attio for Modern CRM Needs
Attio represents the next generation of CRM platforms designed specifically for modern go-to-market teams. Key advantages include:
Native integration capabilities that simplify data synchronization across multiple tools. Attio’s API-first architecture enables seamless data flow between systems.
Advanced relationship mapping that tracks multi-stakeholder engagement patterns essential for modern B2B sales. This includes automatic stakeholder identification and engagement scoring.
Real-time collaboration features that enable sales and marketing teams to work together more effectively on account-based strategies.
Data Enrichment & Intelligence Integration
Accurate metrics require high-quality data, making data enrichment and intelligence platforms essential components of your technology stack.
Clay for Automated Prospecting and Enrichment
Clay’s data enrichment platform transforms how companies approach lead qualification and account intelligence. Implementation best practices include:
Configure automated enrichment workflows that append company data, contact information, and technographic details to every lead immediately upon capture. This enables real-time lead scoring and qualification.
Set up AI-powered research agents that gather competitive intelligence, recent company news, and business context for each prospect. This information improves qualification accuracy and sales conversation quality.
Implement automated lead routing based on enriched data criteria. Leads that meet specific company size, technology, or industry criteria can be automatically assigned to appropriate sales reps.
Build integration workflows between Clay and your CRM that ensure data consistency and eliminate manual data entry. Use Clay’s API to create custom automation that fits your specific business processes.
Apollo for Contact Database Management
Apollo’s B2B database and engagement platform provides comprehensive prospecting capabilities. Key implementation elements include:
Configure advanced search criteria that identify ideal customer profiles based on multiple data points including company size, technology stack, recent funding, and growth indicators.
Set up automated prospecting sequences that combine email, phone, and social outreach across multiple touchpoints. Track engagement metrics for each sequence type and optimize based on response rates.
Implement data synchronization between Apollo and your CRM to ensure prospect information remains current and accessible to sales teams.
N8n for Custom Automation Workflows
N8n’s workflow automation platform enables custom integrations between tools that don’t have native connections. Use cases include:
Build custom data synchronization workflows that move information between specialized tools and your primary CRM system. This ensures all customer touchpoints are tracked in a central location.
Create automated alert systems that notify sales reps when prospects exhibit high-intent behaviors across multiple platforms. These alerts enable timely follow-up when prospects are most receptive.
Implement data quality workflows that identify and correct inconsistencies across your technology stack. This includes duplicate detection, data standardization, and missing information identification.
Analytics & Reporting Infrastructure
Comprehensive metrics tracking requires sophisticated analytics capabilities that go beyond basic CRM reporting.
GA4 for Advanced Web Analytics
Google Analytics 4 provides essential website behavior insights when properly configured for B2B metrics tracking:
Set up enhanced ecommerce tracking that captures detailed user journeys from first visit through conversion. This includes goal configuration, funnel analysis, and attribution modeling.
Configure custom events that track B2B-specific behaviors like pricing page visits, case study downloads, and demo requests. These events enable more sophisticated lead scoring and qualification.
Implement cross-domain tracking for companies with multiple websites or subdomains. This ensures complete visibility into prospect behavior across all digital properties.
Segment for Customer Data Platform
Segment’s customer data platform unifies customer data across all touchpoints and tools:
Configure event tracking that captures all customer interactions across web, mobile, email, and other channels. This creates a unified customer profile that improves metrics accuracy.
Set up automated data routing that sends relevant information to appropriate tools based on customer behavior and characteristics. This ensures each tool has the data it needs for optimal performance.
Implement data governance policies that ensure customer data quality and compliance with privacy regulations while maintaining metrics accuracy.
AI-Powered Optimization Tools
Modern metrics tracking increasingly relies on artificial intelligence to identify patterns and predict outcomes.
OpenAI API for Content Personalization
Integrate OpenAI’s API to create personalized content experiences based on prospect behavior and characteristics:
Build dynamic email sequences that adapt messaging based on prospect engagement patterns and company characteristics. This personalization improves response rates and conversion metrics.
Create automated research summaries that provide sales reps with relevant context before prospect conversations. This preparation improves qualification effectiveness and conversion rates.
Claude API for Data Analysis
Use Claude’s API for advanced data analysis and insight generation:
Implement automated report generation that identifies trends, anomalies, and optimization opportunities in your metrics data. This enables proactive optimization rather than reactive reporting.
Create natural language interfaces for metrics exploration that enable non-technical team members to access and understand complex data insights.
Implementation Best Practices
Successful metrics implementation requires systematic approach that prioritizes data quality, user adoption, and continuous optimization.
Data Quality Foundation
Establish data quality standards and validation processes before implementing advanced metrics tracking. Poor data quality corrupts all downstream analysis and decision-making.
Implement automated data validation that identifies and flags inconsistencies, duplicates, and missing information. Create processes for regular data cleanup and maintenance.
User Training and Adoption
Invest in comprehensive training programs that ensure team members understand how to use metrics effectively. The best technology stack is worthless if teams don’t adopt it properly.
Create role-specific training that focuses on metrics most relevant to each team member’s responsibilities. Sales reps need different metrics knowledge than marketing managers or customer success representatives.
Continuous Optimization Culture
Establish regular review processes that evaluate metrics effectiveness and identify optimization opportunities. Technology stacks should evolve based on business needs and performance insights.
Implement feedback loops that capture user experiences and suggestions for improvement. The most effective metrics implementations continuously evolve based on user needs and business changes.
Implementation Roadmap & Next Steps: Your 90-Day Metrics Transformation
Implementing comprehensive B2B sales funnel metrics requires a systematic approach that balances quick wins with long-term infrastructure development. This roadmap provides a proven framework for transforming your metrics capabilities while maintaining business continuity and team adoption.
30-Day Foundation Phase: Core Metrics and Data Quality
Week 1-2: Metrics Audit and Prioritization
Begin with a comprehensive audit of your current metrics tracking capabilities. Document which metrics you’re currently measuring, how they’re calculated, and where gaps exist in your tracking infrastructure.
Prioritize metrics based on business impact and implementation complexity. Focus first on metrics that directly correlate with revenue outcomes and can be implemented with existing tools and data sources.
Establish data quality standards and begin cleanup processes for your existing CRM and marketing automation data. Poor data quality will corrupt all advanced metrics, making this foundation work essential.
Week 3-4: Quick Win Implementation
Implement the five core metrics that every B2B organization must track: win rate, sales cycle length, pipeline coverage ratio, lead conversion rate by source, and customer acquisition cost. These metrics provide immediate insights and establish momentum for broader implementation.
Configure basic automation workflows in your CRM that capture stage progression timing and deal characteristics. This automation ensures consistent data collection without requiring manual updates from sales teams.
Create initial dashboards that display core metrics with appropriate access controls for different team members. Focus on clarity and actionability rather than comprehensive coverage.
60-Day Expansion Phase: Advanced Tracking and Integration
Week 5-6: Tool Integration and Automation
Implement data enrichment workflows using platforms like Clay or Apollo that automatically append company and contact information to leads. This enrichment enables more sophisticated lead scoring and qualification processes.
Configure marketing automation sequences that track content consumption, engagement patterns, and behavioral signals that predict purchase intent. Use this data to build preliminary lead scoring models.
Establish integration workflows between your primary tools that ensure data consistency and eliminate manual data entry. Focus on critical data flows between marketing automation, CRM, and analytics platforms.
Week 7-8: Advanced Metrics Implementation
Begin tracking multi-stakeholder engagement metrics that reveal how effectively you’re building relationships across buying committees. This requires more sophisticated data collection but provides critical insights for modern B2B sales.
Implement intent data tracking using platforms like RB2B or Demandbase that identify prospects actively researching solutions in your category. This enables proactive outreach to high-intent prospects.
Configure advanced attribution models that track the complete customer journey from initial awareness through closed deals. This attribution enables more effective marketing spend allocation and campaign optimization.
90-Day Optimization Phase: Predictive Analytics and Culture Development
Week 9-10: Predictive Modeling and AI Integration
Build predictive models using historical data to identify patterns that predict successful outcomes. Start with simple models that predict lead-to-opportunity conversion based on engagement patterns and demographic characteristics.
Implement AI-powered content personalization that adapts messaging based on prospect behavior and company characteristics. This personalization typically improves conversion rates by 15-25%.
Configure automated alert systems that notify sales reps when prospects exhibit high-intent behaviors or reach optimal outreach timing based on engagement patterns.
Week 11-12: Culture and Process Optimization
Establish regular metrics review processes that ensure insights drive action rather than just reporting. Create weekly pipeline reviews, monthly performance analyses, and quarterly strategic assessments.
Implement training programs that ensure team members understand how to interpret and act on metrics insights. The most sophisticated metrics are worthless if teams don’t know how to use them effectively.
Create feedback loops that capture user experiences and suggestions for metrics improvements. The most effective implementations continuously evolve based on user needs and business changes.
Priority Metrics by Company Stage
Early-Stage Companies (Under $1M ARR)
Focus on fundamental metrics that establish product-market fit: lead conversion rates, win rates, sales cycle length, customer acquisition cost, and early retention indicators.
Growth-Stage Companies ($1M-10M ARR)
Expand to include pipeline management metrics, advanced attribution, multi-stakeholder engagement tracking, and predictive analytics for forecasting and resource planning.
Scale-Stage Companies ($10M+ ARR)
Implement comprehensive metrics across all funnel stages, advanced predictive modeling, account-based marketing measurement, and sophisticated customer success analytics.
Common Implementation Pitfalls and Solutions
Pitfall 1: Overwhelming Teams with Too Many Metrics
Solution: Start with 5-10 core metrics and expand gradually based on adoption and business needs.
Pitfall 2: Poor Data Quality Corrupting Analysis
Solution: Invest in data cleanup and validation processes before implementing advanced metrics.
Pitfall 3: Metrics Without Action
Solution: Establish clear processes for how metrics insights drive specific business actions and optimizations.
Pitfall 4: Tool Integration Complexity
Solution: Prioritize native integrations and proven platforms over custom solutions that require ongoing maintenance.
Building a Metrics-Driven Culture
Success requires more than just implementing tracking systems. You must build a culture where data-driven decision making becomes the default approach across all revenue operations.
Start by establishing metrics as the common language for revenue discussions. Replace opinions and assumptions with data-backed insights in all sales and marketing meetings.
Create accountability systems where team members are responsible for specific metrics outcomes rather than just activity levels. This shift from activity-based to outcome-based management drives better results.
Implement regular training and development programs that build analytical capabilities across your revenue teams. The most successful organizations treat data literacy as a core competency for all revenue-generating roles.
Your Next Action Steps
The difference between companies that successfully implement comprehensive metrics and those that struggle lies in taking immediate action rather than waiting for perfect conditions.
Don’t let another quarter pass without the metrics infrastructure you need to drive predictable revenue growth. The companies implementing these systems today will have insurmountable competitive advantages tomorrow.
Need the metrics system behind this? delverise builds the GTM Engineering layer that connects CRM data, enrichment, scoring, routing, outbound activation, reporting, and QA so revenue teams can manage funnel performance from one operating model. Explore GTM Engineering, Growth Engineering, CRM Enrichment, and Revenue Operations Automation, or apply to work with us.
Frequently Asked Questions
Why do traditional B2B funnel metrics fail in 2026?
Traditional funnel metrics fail because they assume linear buyer progression, but modern B2B sales cycles average over 100 days and involve 6-10 decision-makers (up to 20 in enterprise deals). Buyers jump between stages, re-enter funnels, and influence each other through complex internal dynamics. Traditional metrics also struggle with multi-touch attribution across extended time periods and miss the shift toward account-based quality measurement, where ABM strategies deliver 76% higher ROI than volume-focused approaches.
What is GTM Engineering and how does it work?
GTM Engineering is a systematic, data-driven approach to go-to-market operations that treats revenue generation as an engineering discipline. It operates on five core principles: systems thinking over funnel thinking, predictive over reactive measurement, account-centric over lead-centric tracking, automation-first implementation, and continuous optimization culture. Rather than viewing sales as a linear funnel, it treats the process as an interconnected system where every metric influences others, enabling whole-system optimization.
How many tools does a modern B2B GTM stack require?
A modern GTM stack typically includes 15-20 different tools that must share data seamlessly to provide accurate, real-time metrics. Core infrastructure includes CRM systems like HubSpot or Salesforce, data enrichment platforms like Clay, prospecting tools like Apollo, analytics platforms like GA4, and customer data platforms like Segment. Each integration point represents potential data quality issues, so tools should be chosen primarily for their API quality and integration capabilities, with standalone features a secondary consideration.
What is account-centric tracking versus lead-centric tracking?
Account-centric tracking measures engagement across all stakeholders within a target account rather than individual lead behavior. Instead of optimizing for lead volume, you optimize for account penetration and multi-stakeholder engagement depth. This shift matters because enterprise software purchases involve mid-level managers, IT leadership, procurement, finance, and C-level executives, each with different concerns. Account-based marketing strategies built on this approach show 76% higher ROI compared to traditional lead-based methods.
What is predictive versus reactive measurement in sales?
Predictive measurement tracks leading indicators that forecast future performance, while reactive measurement only reports what already happened. Traditional metrics report past pipeline coverage and closed revenue. GTM Engineering metrics forecast future coverage needs based on historical conversion patterns and current activity levels. This shift allows teams to act on signals before outcomes are locked in, rather than analyzing closed deals after the fact. Predictive measurement turns metrics into decision tools rather than scorecards.
Read next