←Back to blog
Revenue OperationsGuideSeptember 12, 20268 min read
Revenue Forecasting: How B2B SaaS Teams Build a Forecast That Holds
Revenue forecasting is the practice of predicting how much revenue a company will book and recognize in a future period using pipeline data, historical conversion rates, and capacity assumptions. In B2B SaaS, forecast accuracy depends more on clean stage definitions, honest close dates, and a documented pipeline creation plan than on the sophistication of the model itself.
Revenue forecasting is the practice of predicting how much revenue a company will book and recognize in a future period using pipeline data, historical conversion rates, and capacity assumptions. In B2B SaaS, forecast accuracy depends more on clean stage definitions, honest close dates, and a documented pipeline creation plan than on the sophistication of the model itself.
Key takeaways
- A forecast is only as good as the CRM data underneath it, so stage definitions and exit criteria have to be enforced before any model is worth running.
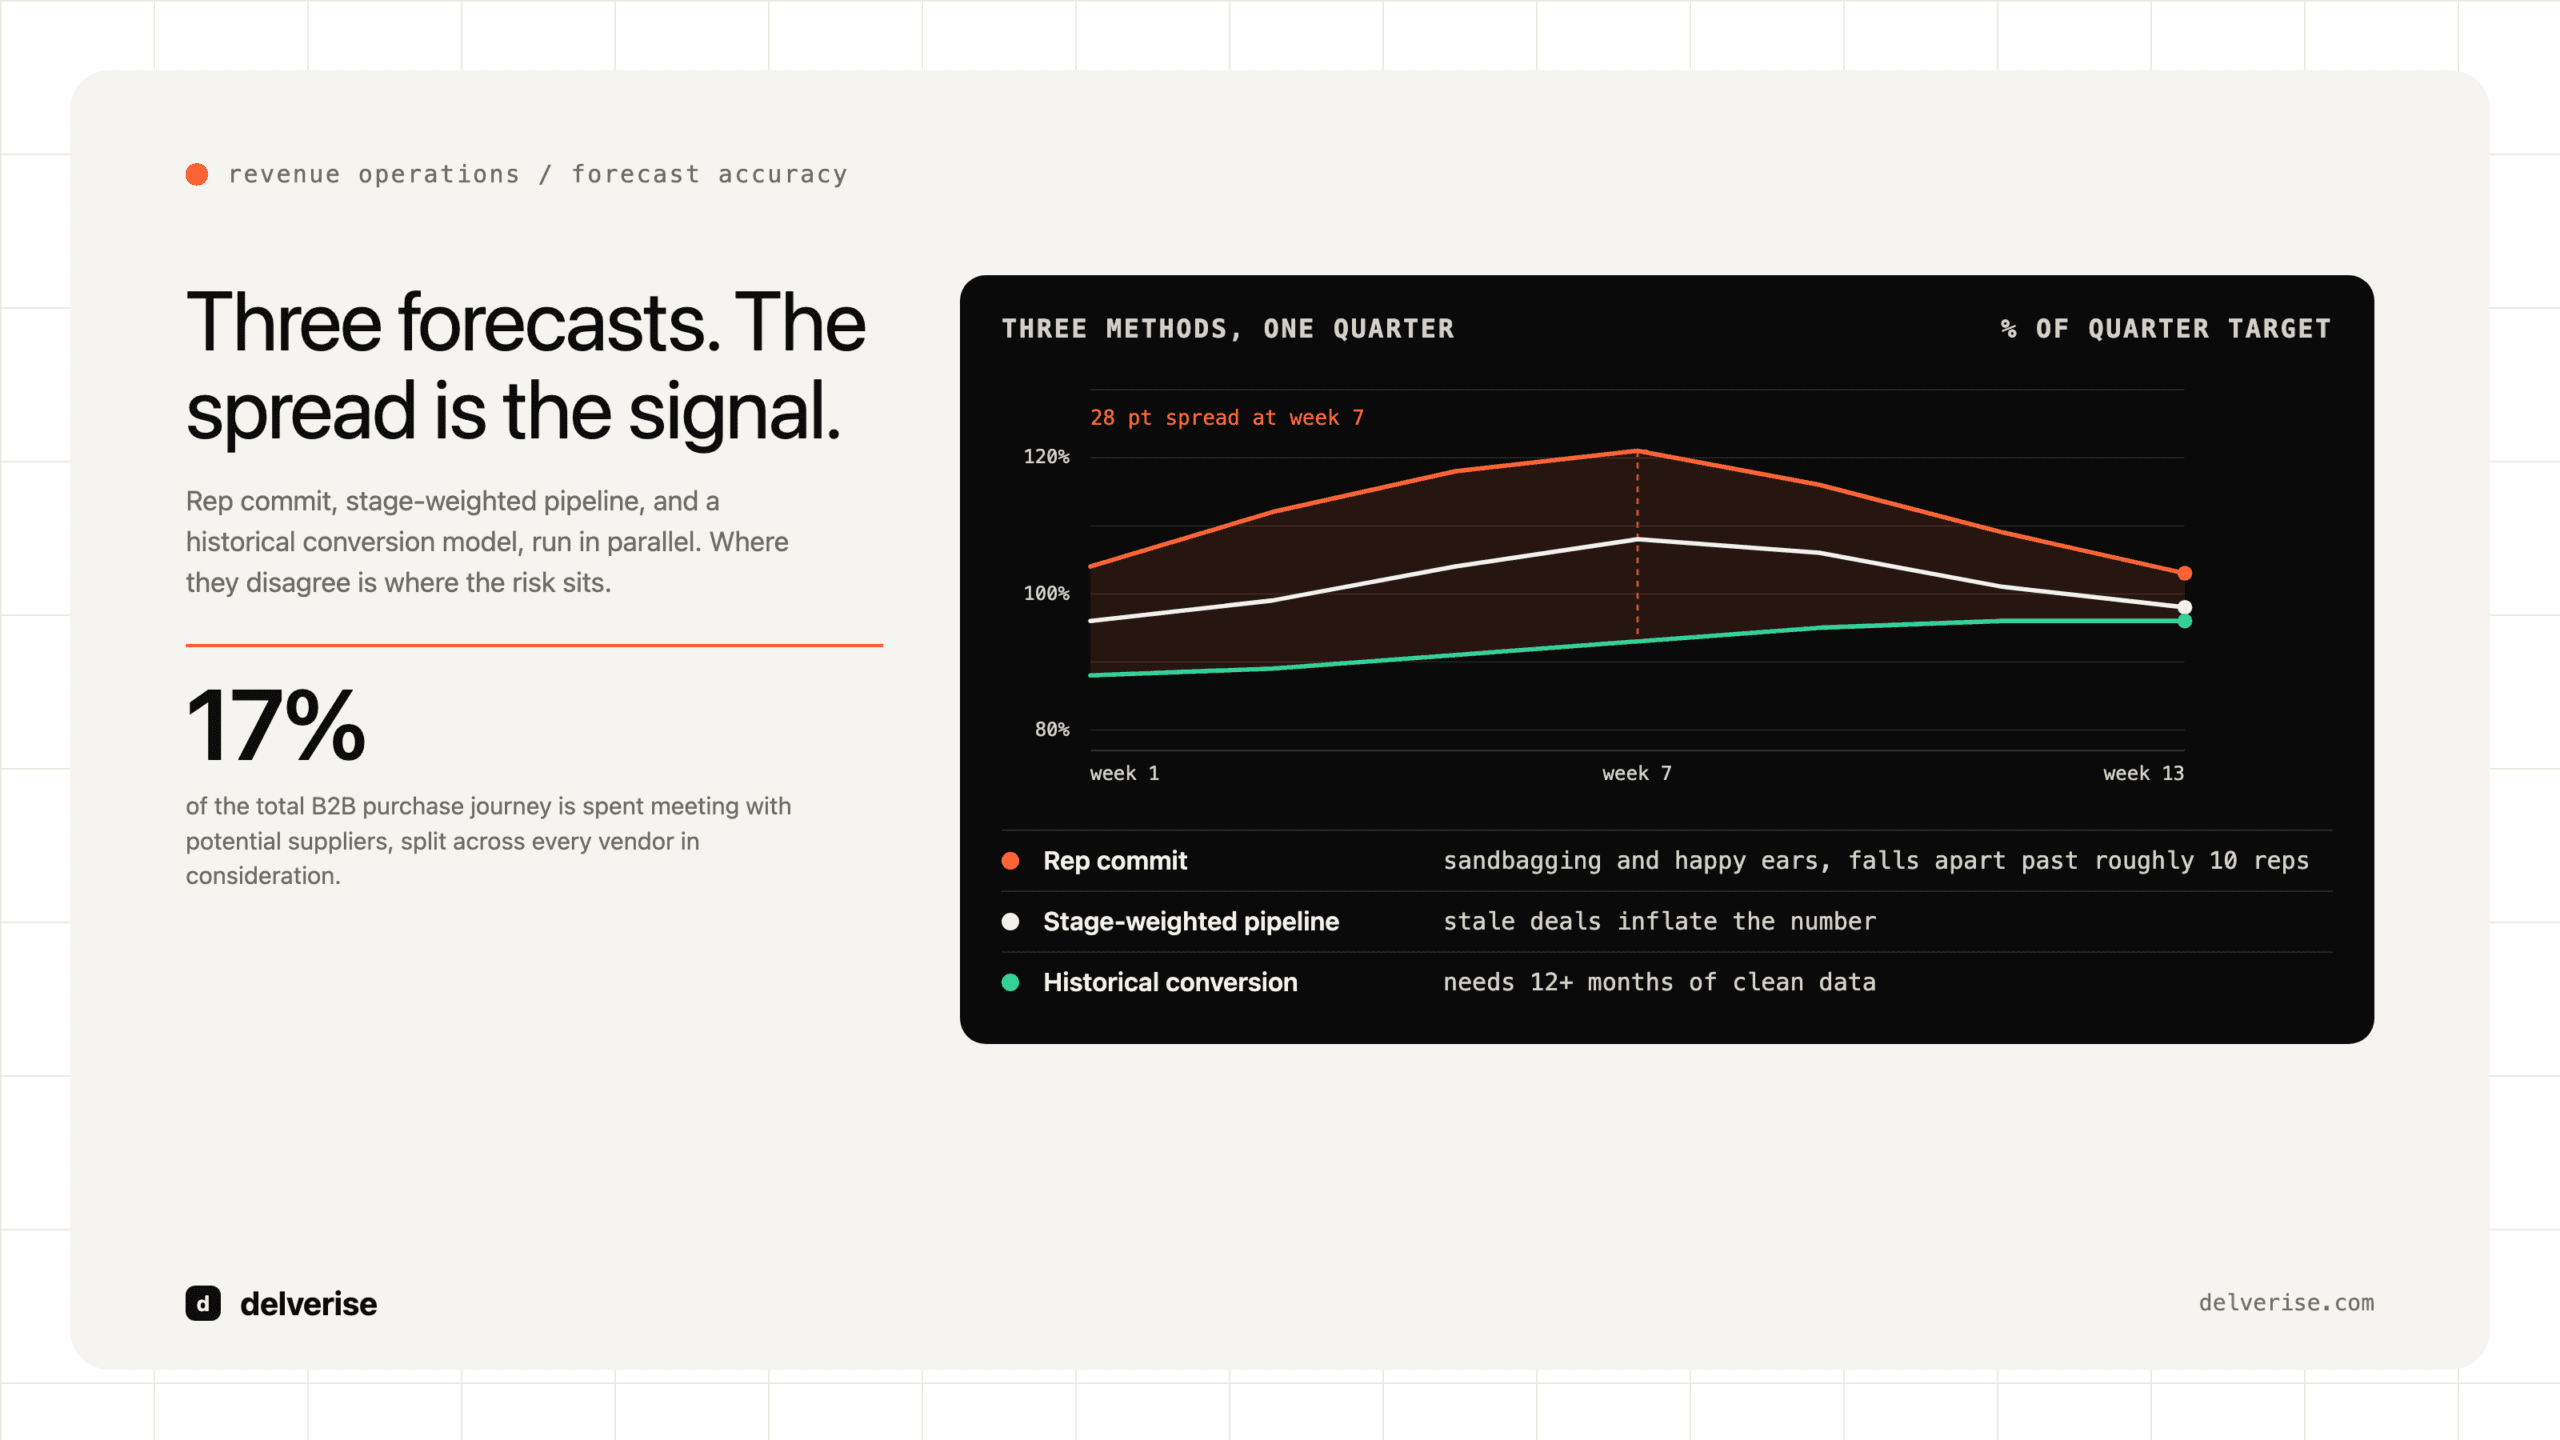
- Most teams need three forecasts running in parallel: rep commit, stage-weighted pipeline, and a historical conversion model. Disagreement between them is the signal.
- Forecasting closed revenue without forecasting pipeline creation gives you a two-quarter blind spot.
- Track forecast accuracy as a metric with an owner, measured at the same point every period.
- Expansion and renewal revenue belong in the same forecast as new business, with their own conversion logic.
Why do B2B SaaS revenue forecasts miss?
Forecasts rarely fail because someone picked the wrong formula. They fail because the inputs describe a deal process that no longer matches how buyers actually buy.

Gartner’s B2B buying research found that buyers spend only about 17% of their total purchase journey meeting with potential suppliers, and that limited time gets split across every vendor in consideration. Gartner has also found that the typical B2B buying group includes six to ten decision makers. McKinsey’s B2B pulse work found that buyers now move across roughly ten channels during a purchase, up from about five in 2016. Your rep sees a fraction of what is happening.
That produces three recurring failure modes:
- Close dates as wishes. A close date set by the rep at the end of discovery reflects quota pressure. A close date derived from the buyer’s stated compelling event reflects reality.
- Stages that mean different things to different reps. If “Demo Completed” means a demo happened for one AE and means a champion agreed to a business case for another, stage-weighted math is arithmetic on noise.
- Forecasting only the deals you can see. Deals closing this quarter were created last quarter. If new pipeline creation is unmodeled, the forecast is accurate right up until it collapses two quarters out.
Which forecasting method should you use?
Run more than one. Each method carries a different bias, and the spread between them tells you where the risk is.

| Method | How it works | Best for | Where it breaks |
|---|---|---|---|
| Rep commit (judgment) | AEs categorize deals as commit, best case, or pipeline; managers roll it up | Small teams, complex enterprise deals, early-stage companies with thin history | Sandbagging and happy ears; no historical calibration; falls apart past roughly 10 reps |
| Stage-weighted pipeline | Each stage carries a probability; forecast is the sum of amount times probability | Teams with disciplined stage definitions and consistent deal sizes | Probabilities set by opinion rather than measured stage-to-close rates; stale deals inflate the number |
| Historical conversion (cohort) | Model conversion by creation cohort and time-in-stage, then project forward | Volume motions, PLG-assisted sales, teams with 12+ months of clean data | Needs real data volume; breaks after a pricing, ICP, or segment change |
| Capacity model | Build up from ramped reps, quota, coverage, and productivity per head | Annual planning, hiring decisions, board-level target setting | Assumes hiring plans land on time; hides quarter-level timing risk |
A practical setup: capacity model for the annual plan, historical conversion for the quarter, rep commit for the current month, with the delta between commit and conversion model reviewed weekly in the forecast call.
What data does a revenue forecast actually need?
Forecast quality is a data engineering problem before it is a modeling problem. The system needs a single source of truth for opportunities, a stage model with written exit criteria, and event-level history of when deals moved between stages. Most CRMs record the current state well and the transition history poorly, which is why time-in-stage analysis is so often unavailable when a team needs it most.
Before building any model, confirm these are in place. Each one gates the next:
- Every stage has a written exit criterion tied to buyer behavior, not seller activity
- Opportunity amount, close date, and stage are required fields with validation rules
- Stage-change history is captured with timestamps, so time-in-stage is queryable
- Lead source and campaign attribution persist from first touch through closed won
- Renewals and expansion opportunities exist as records, with their own stage model
- Deals with a close date in the past are auto-flagged for review every Monday
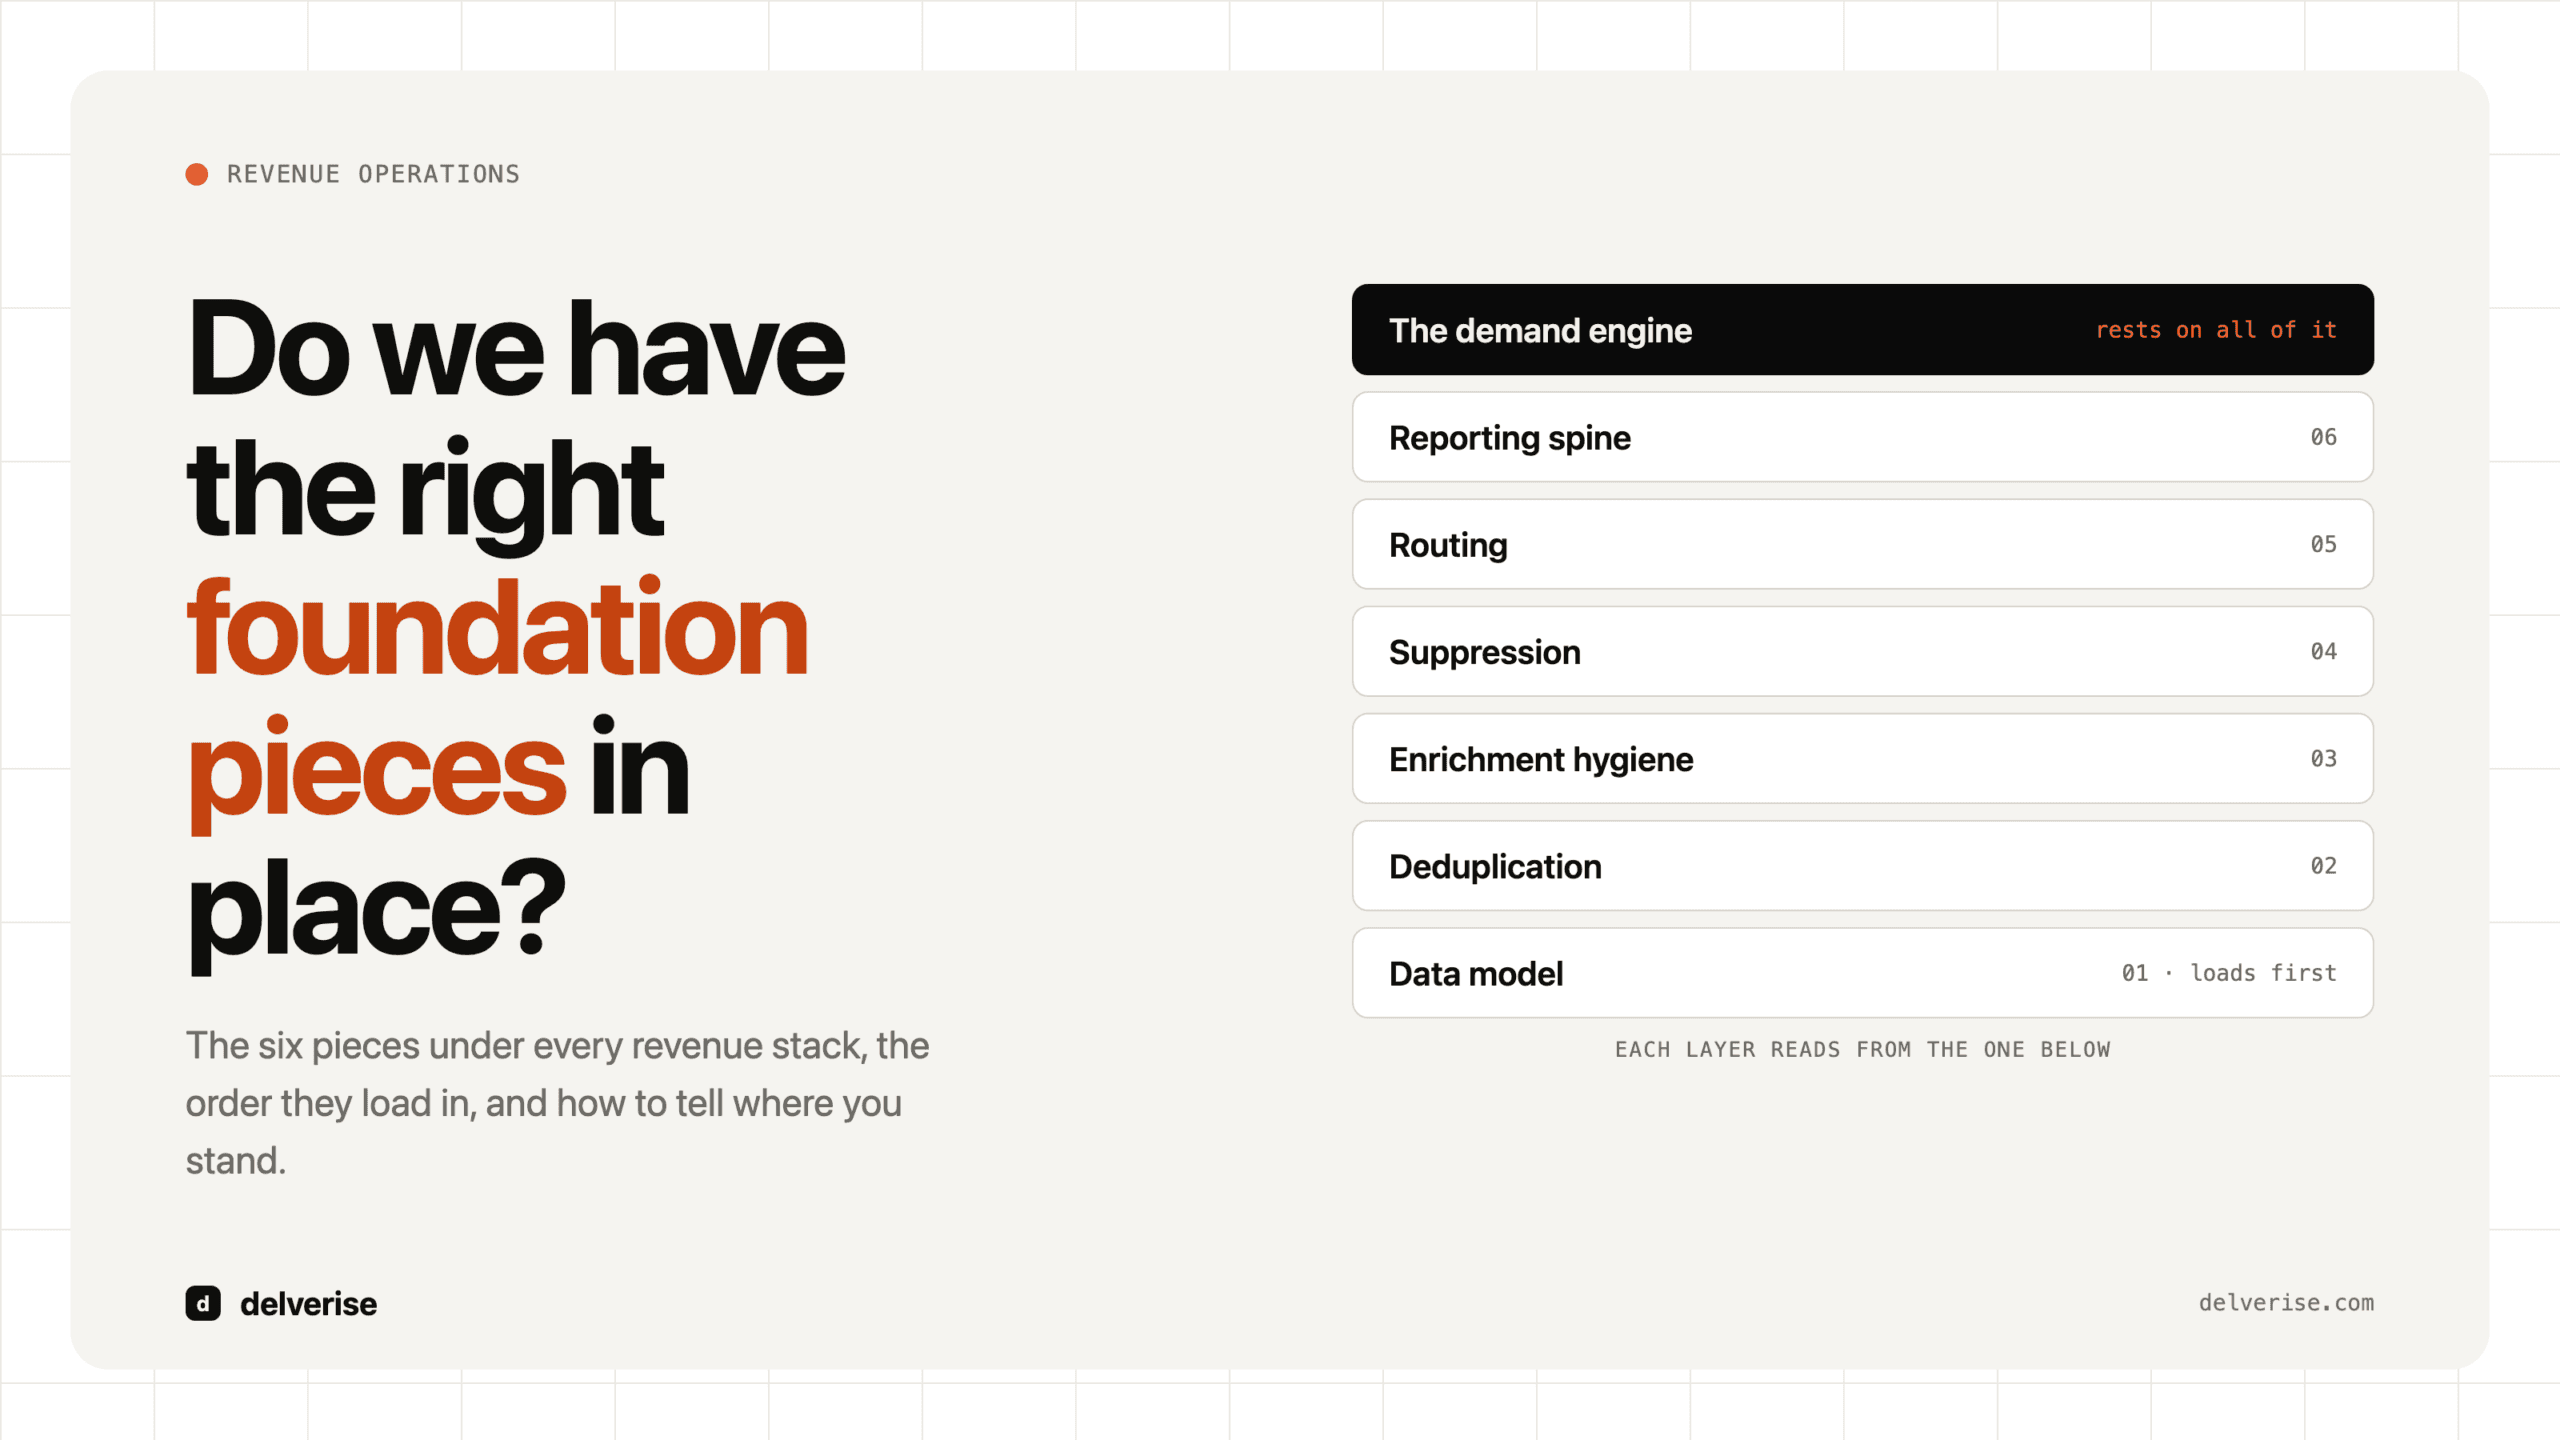
These are the same foundations that make attribution and pipeline reporting work, which we covered in the six pieces under every revenue stack. A team that skips them ends up with a forecast that gets rebuilt in a spreadsheet every quarter by whoever has the most patience.
What does a bottoms-up forecast look like in practice?
Take a company at $6M ARR targeting $2.4M in new ARR over the next four quarters. Average contract value is $30,000, blended win rate from qualified opportunity to closed won is 22%, and the average sales cycle is 75 days.

| Input | Value | Derivation |
|---|---|---|
| New ARR target | $2,400,000 | Board plan |
| Average contract value | $30,000 | Trailing 12 months, new business only |
| Deals required | 80 | $2.4M / $30K |
| Win rate (qualified opp to won) | 22% | Trailing 12 months |
| Qualified opportunities required | 364 | 80 / 0.22 |
| Qualified opps per quarter | 91 | 364 / 4 |
| AE capacity at 12 active opps each | 7.6 AEs | 91 opps over a 75-day cycle |
Two things fall out of this immediately. First, the plan needs roughly 91 qualified opportunities created every quarter, and because the cycle is 75 days, Q1 revenue depends on pipeline created in the prior quarter. Second, eight carrying AEs is a hiring and ramp problem that has to start two quarters before the revenue does.
Now stress the assumptions. If win rate drops to 18%, required opportunities jump from 364 to 444, a 22% increase in pipeline demand from a four-point move. If ACV rises to $35,000 through better qualification, deals required fall to 69. Sensitivity on win rate and ACV usually moves the plan more than any change to top-of-funnel volume, which is why qualification rigor pays twice.
How do you forecast pipeline creation, not closed deals alone?
The 91 opportunities per quarter is a target that needs its own model, broken out by source with separate conversion logic for each. Outbound converts at different rates and on different timelines than inbound or partner-sourced pipeline, and blending them hides the problem until it is a quarter old.
For outbound, the chain runs from accounts targeted to contacts reached to meetings booked to qualified opportunities, and each step has a measurable rate you can hold steady while you change volume. We broke that structure down in detail in how B2B SaaS teams build an outbound funnel that converts. Capacity math matters here too: a realistic per-rep output assumption keeps the plan honest, and what one outbound SDR actually produces covers the ranges worth planning against.
Expansion deserves the same treatment. SaaStr’s benchmark writing has argued consistently that at scale a large share of new ARR comes from the existing base through expansion and upsell, yet most forecasts treat renewals as a spreadsheet tab owned by customer success. Model expansion opportunities as records with stages and close dates, and the forecast stops surprising you in the back half of the year.
How do you measure whether your forecast is working?
Pick a snapshot point and hold it. Most teams use the forecast as of day one of the quarter and day 45, then compare both against actuals.
- Forecast accuracy: actual divided by forecast, tracked by segment and by manager. Consistent overcall by one team is a coaching problem with a known fix.
- Slippage rate: percentage of committed deals that push to the next period. Above 20% and your stage exit criteria are too loose.
- Pipeline coverage: open pipeline divided by target. The right multiple is whatever your win rate implies, so a 22% win rate points to roughly 4.5x rather than a generic 3x.
- Created-to-closed lag: median days from opportunity creation to close, which tells you how far ahead pipeline gaps become visible.
AI helps most in scoring which open deals resemble past wins and in flagging engagement decay before a rep notices, and that scoring is only as good as the qualification data feeding it, a point we made in what AI lead qualification actually scores. Treat model output as a second opinion in the forecast call rather than a replacement for the pipeline review.
Building this well is a systems project spanning CRM architecture, data capture, and reporting, which is the kind of work delverise takes on inside GTM engineering engagements. The payoff is a number the CEO can defend to a board without a spreadsheet rebuild the night before.
Frequently Asked Questions
What is a good forecast accuracy target for B2B SaaS?
Mature teams land within 5% to 10% of the quarter-start forecast. Companies under $10M ARR with fewer than 100 deals per year should expect wider variance, closer to 15% to 20%, because small deal counts make single-deal timing swings dominate the number. Track the trend in your own accuracy before benchmarking against anyone else.
How far out can a B2B SaaS company forecast reliably?
One quarter with real confidence, two quarters directionally, and the full year as a capacity-driven plan rather than a deal-level projection. The limit is set by your sales cycle: if deals take 75 days, anything beyond about 150 days is a model of pipeline you have not created yet.
Should we use stage probabilities from our CRM’s default settings?
No. Default probabilities ship as round numbers that reflect no company’s actual data. Calculate your own by taking every opportunity that entered each stage over the trailing 12 months and dividing the number that eventually closed won by the total. Recalculate quarterly, and after any ICP or pricing change.
Who should own the revenue forecast?
RevOps owns the model, the data, and the accuracy metric. Sales leadership owns the commit number. Separating these keeps the forecast from becoming a negotiation, and it gives the CEO one person to ask when the model and the commit disagree.
Do we need a dedicated forecasting tool?
Most teams under $20M ARR can run an accurate forecast from CRM data plus a warehouse and a BI layer. Dedicated forecasting platforms earn their cost once you have multiple segments, several sales managers, and enough historical volume for their models to calibrate. Fix the stage definitions and history capture first, because a tool applied to inconsistent data reproduces the same errors faster.
Read next