←Back to blog
Revenue Intelligence & Data ToolingGuideJuly 12, 20269 min read
Sales Lead Gen: How B2B SaaS Teams Build Pipeline That Compounds
Sales lead gen is the system a B2B company uses to find in-market accounts, capture buying signals, qualify them, and route them to sellers. In SaaS it works when data, enrichment, scoring, routing, and outreach run as one instrumented pipeline with shared definitions and a single owner for the number.
Sales lead gen is the system a B2B company uses to find in-market accounts, capture buying signals, qualify them, and route them to sellers. In SaaS it works when data, enrichment, scoring, routing, and outreach run as one instrumented pipeline with shared definitions and a single owner for the number.
Key takeaways
- Sales lead gen is a system, and most teams run it as four disconnected channel experiments with four different definitions of “qualified.”
- Buyers do the majority of their research without you. Gartner’s research on B2B buying groups found that buyers spend only about 17% of the purchase journey meeting with potential suppliers, split across every vendor they consider.
- Data quality sets the ceiling on everything downstream. A perfect sequence sent to a stale contact still fails.
- The unit that matters is not leads. It is qualified pipeline per dollar and per rep hour, tracked from first touch to closed revenue.
- Compounding comes from instrumentation: every rejected lead, every bounced email, and every stalled deal should feed back into scoring and targeting.
What does “sales lead gen” actually mean in B2B SaaS?
Sales lead gen (short for sales lead generation) is the set of motions that turn an anonymous market into named, contactable, prioritized buying groups your sellers can work. It spans inbound capture, outbound prospecting, product-led signals, partner referrals, and events. The word “lead” is doing a lot of quiet damage here, because in most SaaS companies it means at least three different things: a form fill, an enriched contact record, and a person a rep has agreed to call.
Those three definitions live in different tools, get counted by different teams, and produce board slides that do not reconcile. Before you buy another data vendor, write down what a lead is, who owns it at each stage, and what has to be true for it to move. That single document is worth more than most tooling decisions.
A term worth defining early: buying signal. A buying signal is any observable behavior or firmographic change that raises the probability an account is in market right now. Hiring a VP of Revenue Operations, opening a second office, appearing on a G2 category page, or having three people from the same domain read your pricing page in a week are all signals. Job titles alone are not signals. They are filters.
Why do most sales lead gen programs stall?
They stall because the constraint moves and nobody notices. A team spends two quarters fixing top-of-funnel volume, finally hits the meeting target, and then discovers the real bottleneck was always qualification. Meetings go up, win rate goes down, and the cost per closed deal is unchanged.
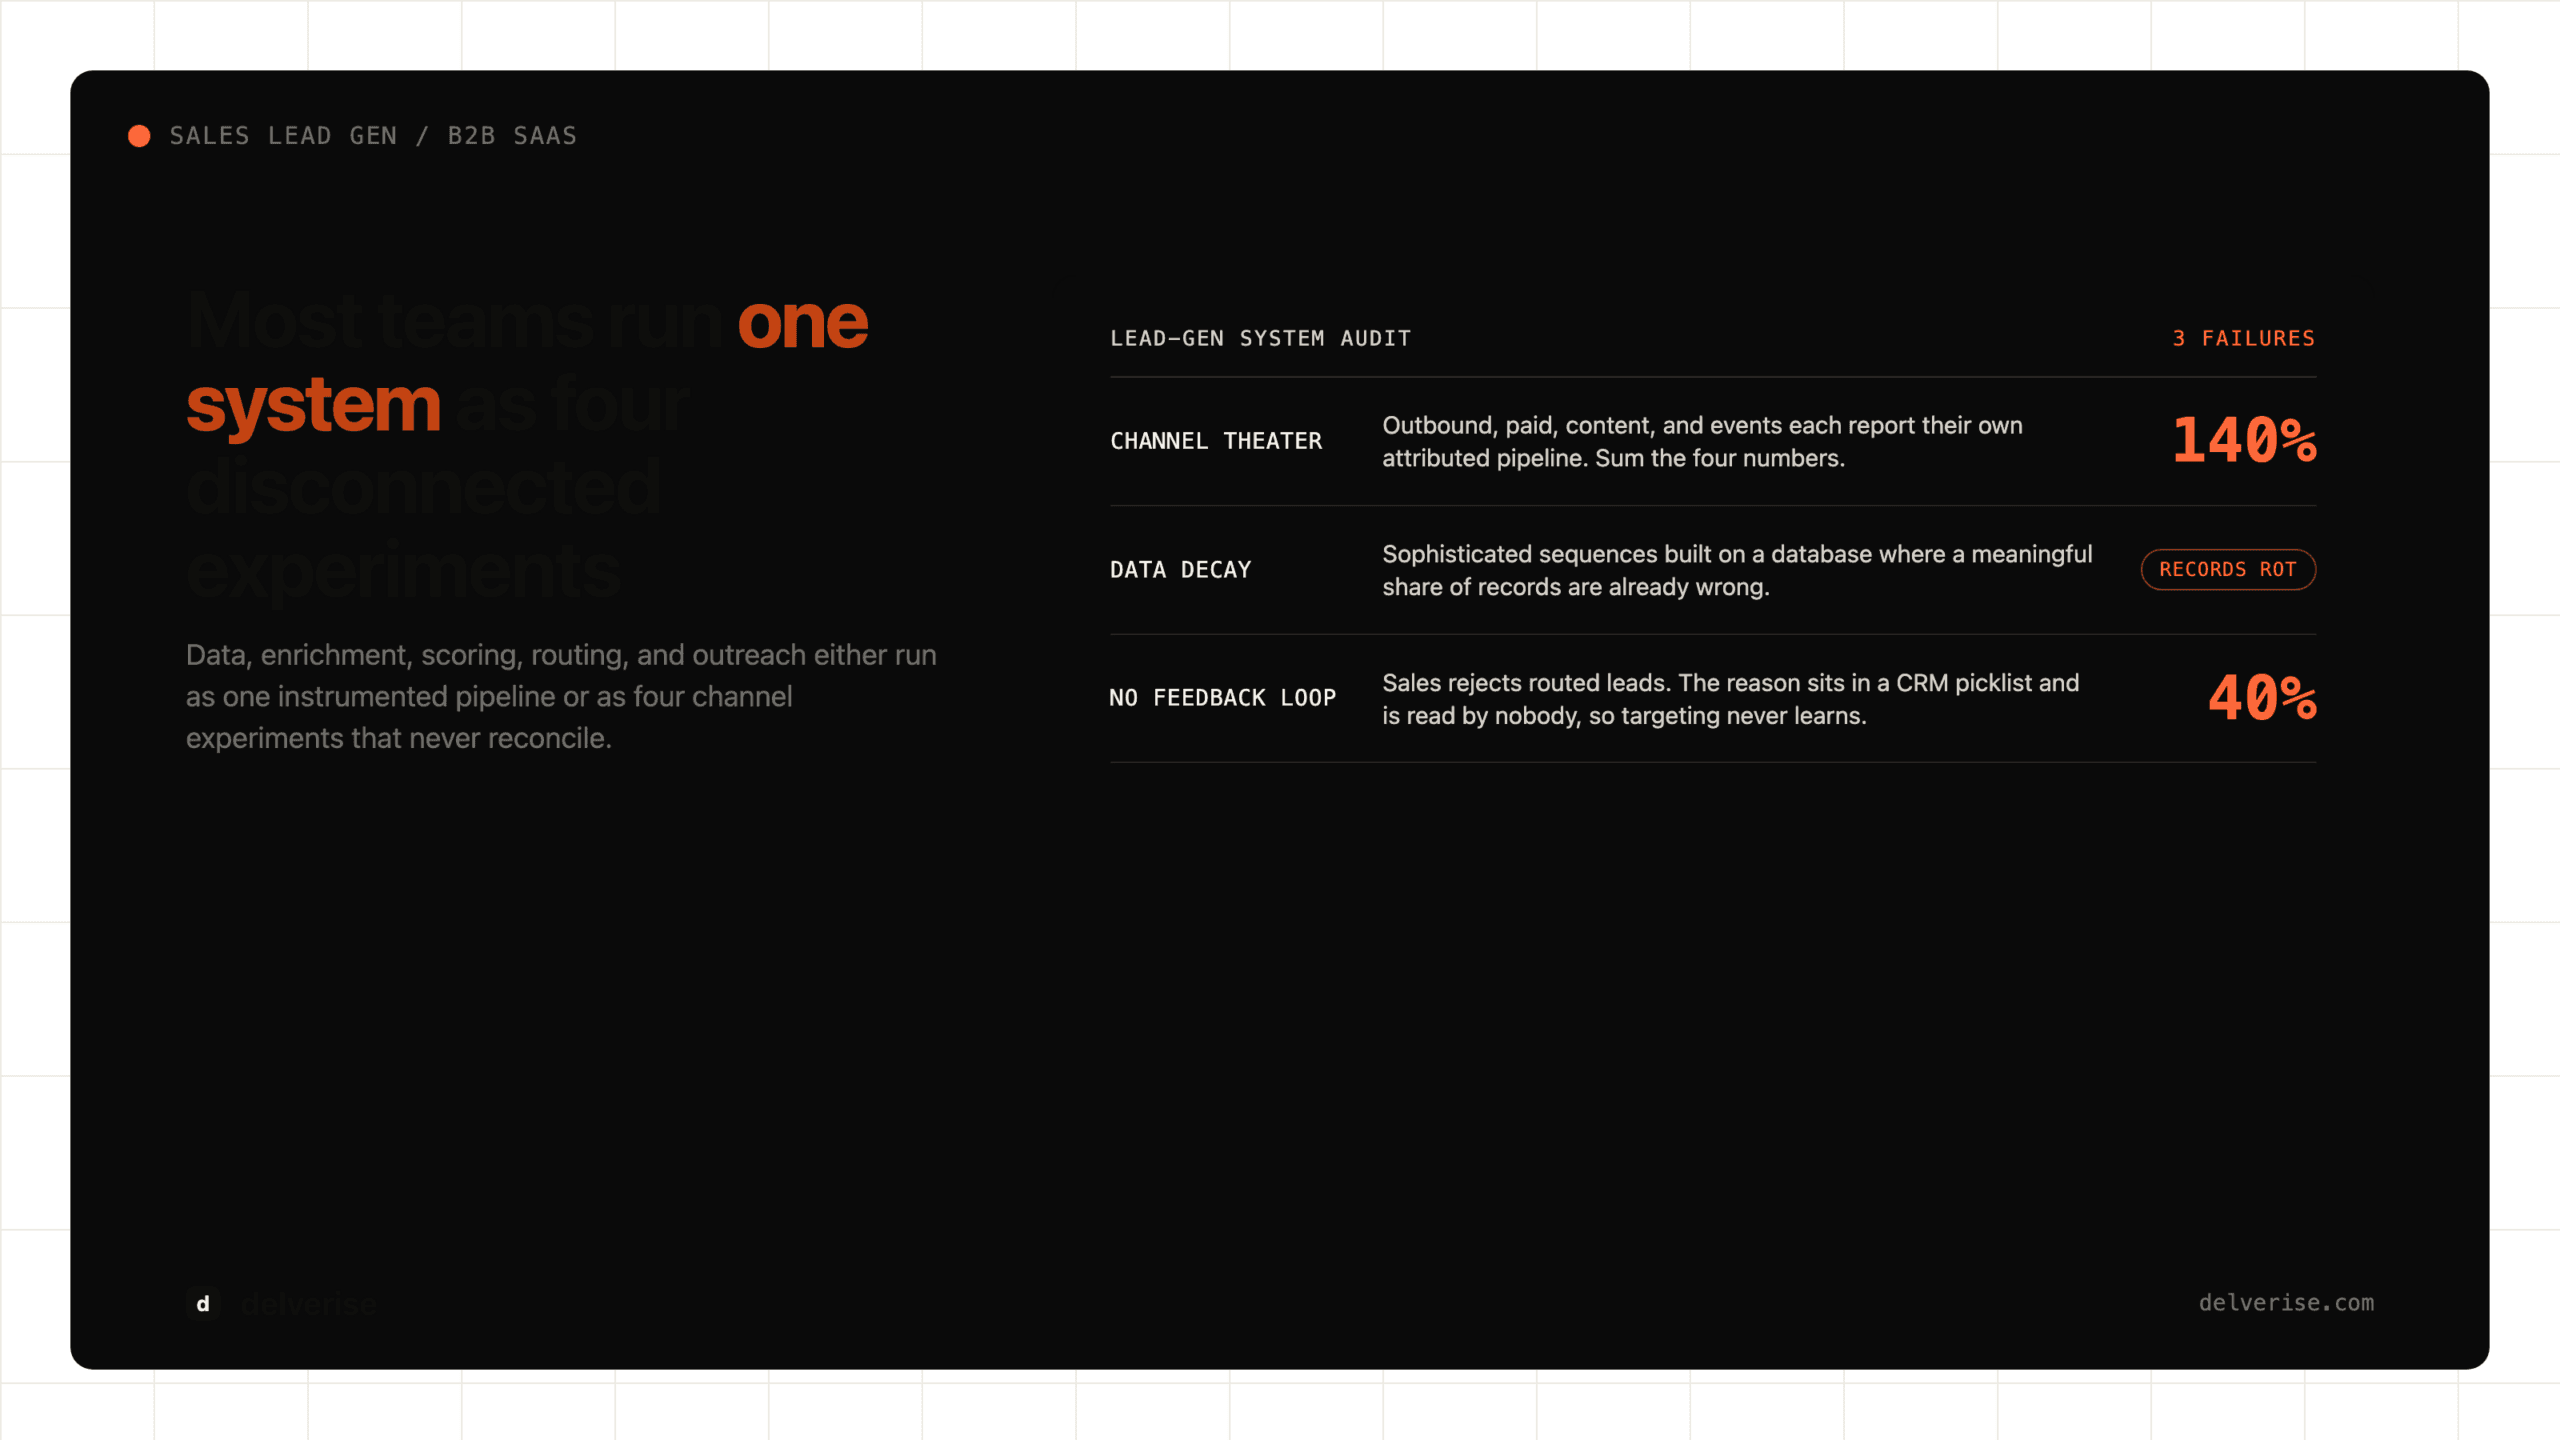
Three failure patterns show up repeatedly in Seed to Series B companies:
- Channel theater. Outbound, paid, content, and events each report their own attributed pipeline. Sum the four numbers and you get 140% of actual pipeline. Nobody can say which motion to double.
- Data decay. B2B contact data goes stale fast as people change roles. Teams build sophisticated sequences on top of a database where a meaningful share of records are already wrong, then blame the copy.
- No feedback loop. Sales rejects 40% of routed leads. That rejection reason is logged in a CRM picklist and read by nobody. The targeting model never learns.
There is a harder truth underneath. McKinsey’s B2B Pulse research found that buyers now use roughly ten channels across a single purchase journey, up from about five a decade ago. If your lead gen system only observes one or two of those channels, your attribution is guessing and your prioritization inherits that guess. Our breakdown of the funnel metrics that actually drive revenue goes deeper on which of these to instrument first.
What are the layers of a working sales lead gen system?
Think of it as five layers stacked on each other. Weakness in a lower layer caps everything above it.

| Layer | What it does | Common failure | Who should own it |
|---|---|---|---|
| 1. Market definition | Defines ICP, segments, and total addressable account list | ICP written once at Seed, never revisited after 40 closed deals | CEO / CRO |
| 2. Data and enrichment | Resolves accounts to contacts, verifies emails, appends firmographics and technographics | Single-vendor dependency, no waterfall, unmeasured match rates | RevOps / GTM engineering |
| 3. Signal and scoring | Ranks accounts by real buying intent, not by title match | Points-based scoring nobody has validated against closed-won data | RevOps + Marketing |
| 4. Routing and orchestration | Gets the right account to the right rep at the right moment | Round-robin assignment, 48-hour response lag | RevOps |
| 5. Outreach and conversion | Sequences, calls, ads, content, demos | Optimized first while layers 2 and 3 are broken | Sales + Marketing |
Most teams start at layer five because it is the most visible and the easiest to buy. Copy gets rewritten, a sales engagement platform gets swapped, an SDR gets hired. The returns are real but small, because the ceiling was set two layers down.
How do you decide where to invest first? A worked example
A Series A company sells workflow software to mid-market operations teams. Annual contract value is $24,000. The team sends 8,000 cold emails a quarter and books 40 meetings. Sales closes 6 deals. Leadership wants to double pipeline and assumes the answer is doubling send volume.
Pull the actual numbers apart:

- 8,000 sends, 6% reply rate, 480 replies
- Of those replies, 40 convert to meetings, an 8.3% reply-to-meeting rate
- 15% of meetings close, producing 6 deals and $144,000 in new ARR
- Email verification shows 22% of the list bounced or hit catch-all addresses that were never delivered
Doubling sends to 16,000 costs roughly double in SDR time, sending infrastructure, and domain reputation risk, and it produces about 12 deals if nothing else changes. Now compare that to fixing layer two. Cleaning the 22% delivery loss recovers 1,760 landed emails per quarter at no extra SDR hours. Adding a signal filter that only contacts accounts showing a hiring or tooling change lifts reply-to-meeting rate from 8.3% to 14%, because you are reaching people with an active problem.
Same 8,000 sends, better inputs: roughly 6,240 landed emails, ~375 replies, ~52 meetings, ~8 deals. Then apply that signal filter to the original volume and the math compounds. The point is that the expensive lever, volume, was the third-best lever available. This is the analysis worth running before any headcount request, and it is the reason scoring leads against real buying intent outperforms scoring against job titles.
Which tools belong in a sales lead gen stack?
Vendor-neutral answer: fewer than you think, chosen after you know your constraint. Three honest observations from building these systems.
Databases are commodities with different blind spots. Apollo has broad coverage and an accessible price point, which makes it a reasonable default for early outbound. Its data quality varies significantly by region and by company size. If you sell to European mid-market, verify before you commit. We covered the tradeoffs in detail in our guide to Apollo.io for revenue leaders, and the same discipline applies to every provider on the market. Compare providers on match rate against your ICP, not on total record count.
Orchestration beats accumulation. Tools like Clay matter because they let you run enrichment waterfalls: try provider A, fall back to B, fall back to C, verify, then act. That structure typically lifts match rates well above any single source while lowering cost per verified contact, since you only pay the expensive provider when the cheap one misses. The tradeoff is real. Clay rewards teams with someone who can think in systems and will frustrate teams looking for a turnkey button. If you want the waterfall built and maintained without hiring for it, that is what our Clay implementation work exists for.
Your CRM is the scoreboard, and it is probably lying. Field hygiene, stage definitions, and rejection reasons determine whether any of this compounds. Instrument the CRM before you buy anything that writes into it. For a broader survey of what is available and where each category fits, our platform comparison and selection guide lays out the categories side by side.
What should a revenue leader build first?
Run this in order. Each item is a week or less for a team that has the data access.

- Write one definition of a qualified lead that sales, marketing, and the board all sign.
- Measure your actual email deliverability and match rate against your ICP list, not your full database.
- Pull the last 50 closed-won deals and identify the three signals present before the first touch.
- Log rejection reasons on every lead sales declines, and review them monthly.
- Instrument time from signal to first human contact. Anything over 24 hours is leaking pipeline.
- Calculate qualified pipeline per dollar for each channel, using the same attribution rule for all of them.
That last item is where most conversations with revenue leaders end up. Once every channel is measured with one rule, the investment decision usually makes itself. Teams that want the full menu of channel-level tactics can work through our research-backed B2B lead generation strategies, but the sequencing above comes first.
How does sales lead gen compound instead of plateau?
Compounding requires that each cycle makes the next cycle cheaper. Three mechanisms do that work.
First, signal libraries. Every closed-won deal teaches you which signals precede purchase. Codify them, and your outbound list gets more accurate every quarter without more spend.
Second, content that answers real buying questions. Harvard Business Review’s work with Gartner on B2B buying found that customers who perceived supplier-provided information as genuinely helpful in making sense of their options were dramatically more likely to buy a larger, higher-quality deal. Helpful content lowers the cost of every future touch, in every channel.
Third, system ownership. Someone must own the pipeline end to end, with authority over data, scoring, and routing. Split ownership across marketing and sales and the feedback loop breaks at the seam. This is the core of what GTM engineering does: treat the revenue pipeline as infrastructure that gets versioned, measured, and improved rather than as a collection of campaigns.
Sales lead gen stops being a quarterly scramble when the system carries the memory. Build the layers in order, measure with one ruler, and let the data you already own tell you where the constraint sits.
Frequently Asked Questions
What is the difference between sales lead gen and demand generation?
Demand generation creates awareness and interest in a category or product across a market. Sales lead gen identifies and qualifies the specific accounts and people ready to buy, then routes them to sellers. Demand gen widens the pool. Lead gen fishes in it. Companies that fund one without the other either run out of names or run out of interest.
How many leads does a B2B SaaS company need per month?
Work backwards from revenue, never forwards from volume. Take your quarterly new ARR target, divide by average contract value to get required closed deals, then divide by your stage conversion rates in reverse. If you close 15% of opportunities and convert 30% of qualified leads to opportunities, each closed deal requires roughly 22 qualified leads. The number that matters is qualified leads, and most teams inflate it by counting form fills.
Is outbound still effective for sales lead gen in 2026?
Yes, with a caveat. Volume-based outbound has collapsing returns as inbox filtering tightens and buyers get more selective. Signal-based outbound, where you contact accounts showing observable buying behavior, still produces strong reply and meeting rates. The difference is the data layer beneath the sequence, not the channel itself. Teams that keep sending more to the same lists will keep seeing declining performance.
Should we hire SDRs or build a lead gen system first?
Build the system. An SDR joining a team with clean data, validated signals, and fast routing will book meetings in week three. An SDR joining a team with a stale database will spend six months proving the database is stale. Hiring is the expensive way to discover a data problem. Diagnose the constraint, fix the layer that caps output, then add headcount to a working machine.
How long before a new sales lead gen system shows results?
Deliverability and routing improvements show up within two to four weeks, because they affect touches already happening. Scoring and signal work shows up in one full sales cycle, since you need enough closed and rejected deals to validate the model. Pipeline per dollar improvements are usually visible by the end of the second quarter. Anyone promising closed revenue in 30 days is selling on a sales cycle that is not yours.
Read next