←Back to blog
Revenue Intelligence & Data ToolingGuideJuly 28, 20267 min read
Leads Map: How Revenue Teams Turn Scattered Data Into a Buyable Market
A leads map is a structured, continuously enriched view of every account and contact inside your addressable market, organized by fit, buying signal, and relationship, so revenue teams can see who to reach, in what order, and why. It replaces scattered lists with one queryable model of the market you actually sell into.
A leads map is a structured, continuously enriched view of every account and contact inside your addressable market, organized by fit, buying signal, and relationship, so revenue teams can see who to reach, in what order, and why. It replaces scattered lists with one queryable model of the market you actually sell into.
Key takeaways
- A leads map is a living data model of your total addressable market, not a static export or a one-time list purchase.
- It combines firmographic fit, contact-level data, and behavioral signals so prioritization becomes a query instead of a guess.
- The value shows up in routing, coverage, and forecast accuracy, because reps work the right accounts and leadership sees white space clearly.
- Building one well depends on match rates, enrichment quality, and a single source of truth, usually your CRM plus an orchestration layer.
- Most teams stall because they treat the map as a project with an end date. It works when it runs as a system that updates itself.
What is a leads map, exactly?
A leads map is the answer to a question most go-to-market teams cannot answer cleanly: of every company we could sell to, which ones exist, who works there, how well they fit, and how ready are they to buy right now. Firmographic fit means the observable traits of an account, such as industry, headcount, revenue band, tech stack, and geography, that predict whether your product is relevant. Buying signal means observable behavior or events, such as a funding round, a new hire in a relevant role, hiring velocity, or product usage, that suggests timing.
Put those layers on top of a clean contact set and you get a map. Each account carries a fit grade, each contact carries verified reachability data, and the whole set updates as the market moves. Gartner’s research on B2B buying has repeatedly found that buyers spend only a small fraction of their journey talking to any single vendor, which means the window to reach the right person at the right moment is narrow. A leads map exists to widen your odds of catching that window.
How is a leads map different from a lead list?
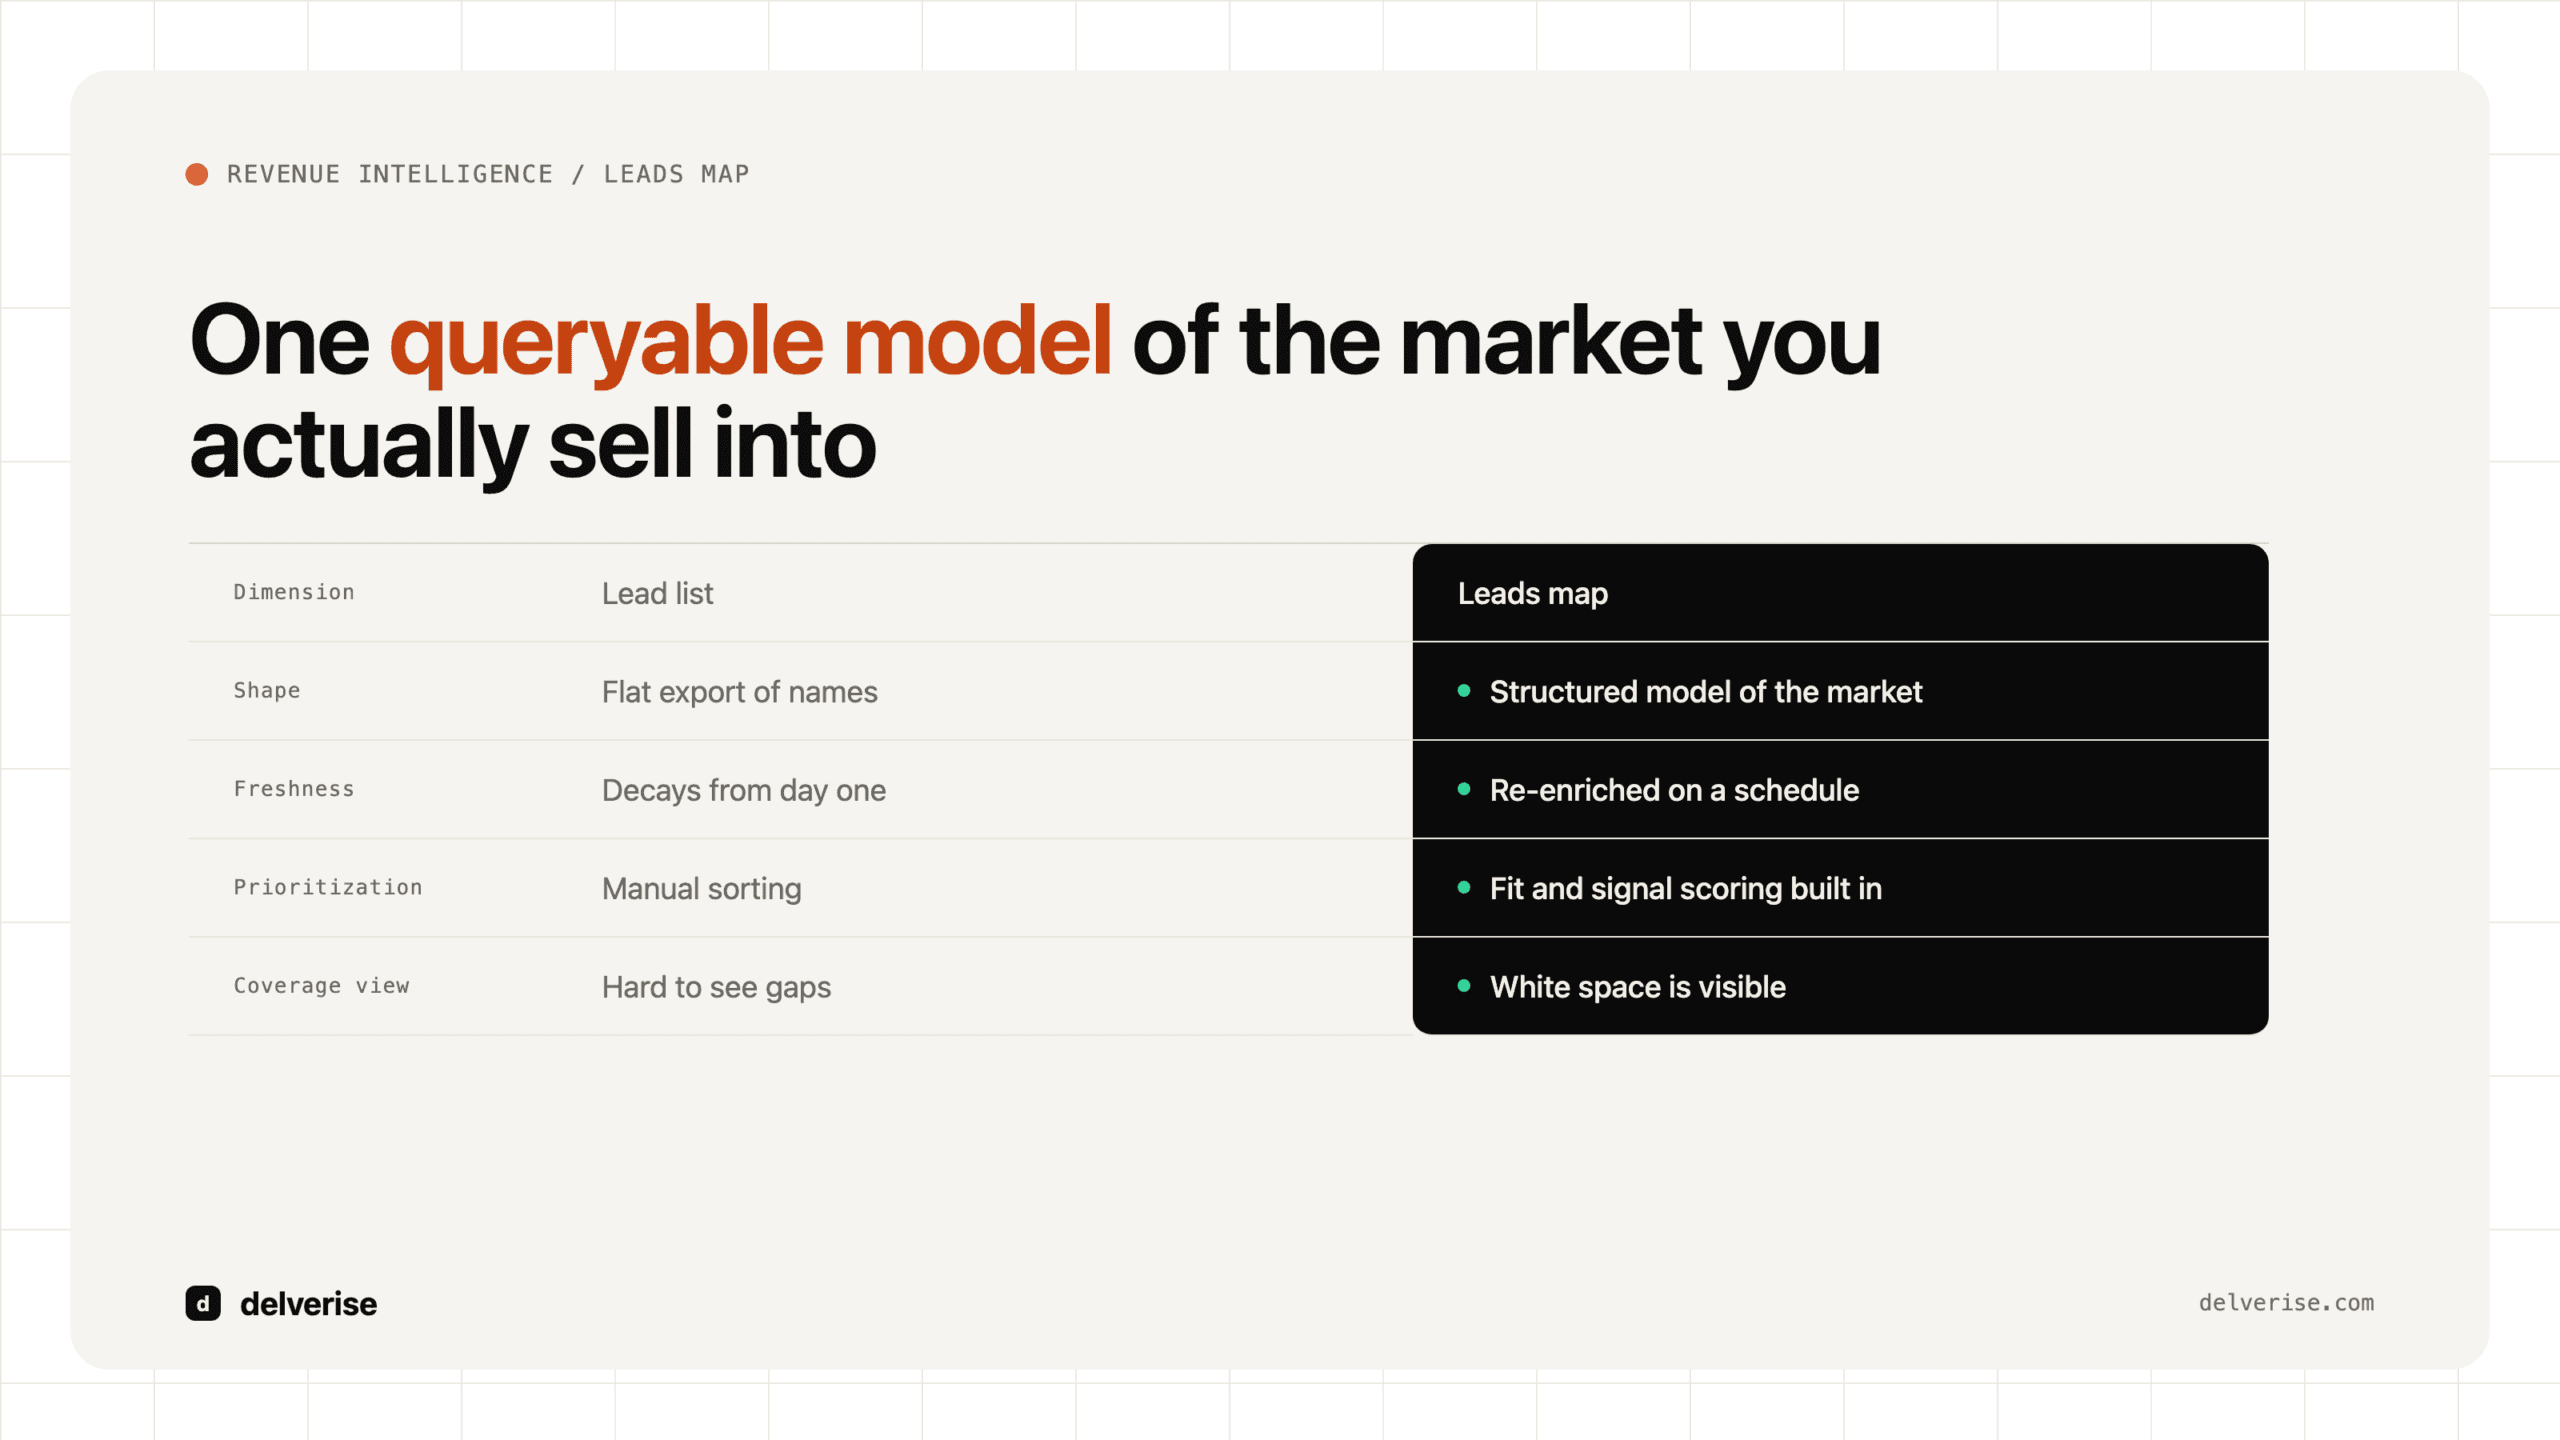
A lead list is a snapshot. You buy or export a set of names, work them until they go stale, and repeat. A leads map is a model that persists and improves. The distinction matters because decay is brutal: contact data degrades quickly as people change jobs, and a list bought in January describes a market that no longer exists by summer.

| Dimension | Lead list | Leads map |
|---|---|---|
| Shape | Flat export of names | Structured model of the market |
| Freshness | Decays from day one | Re-enriched on a schedule |
| Prioritization | Manual sorting | Fit and signal scoring built in |
| Coverage view | Hard to see gaps | White space is visible |
| Ownership | Passed between tools | Single source of truth |
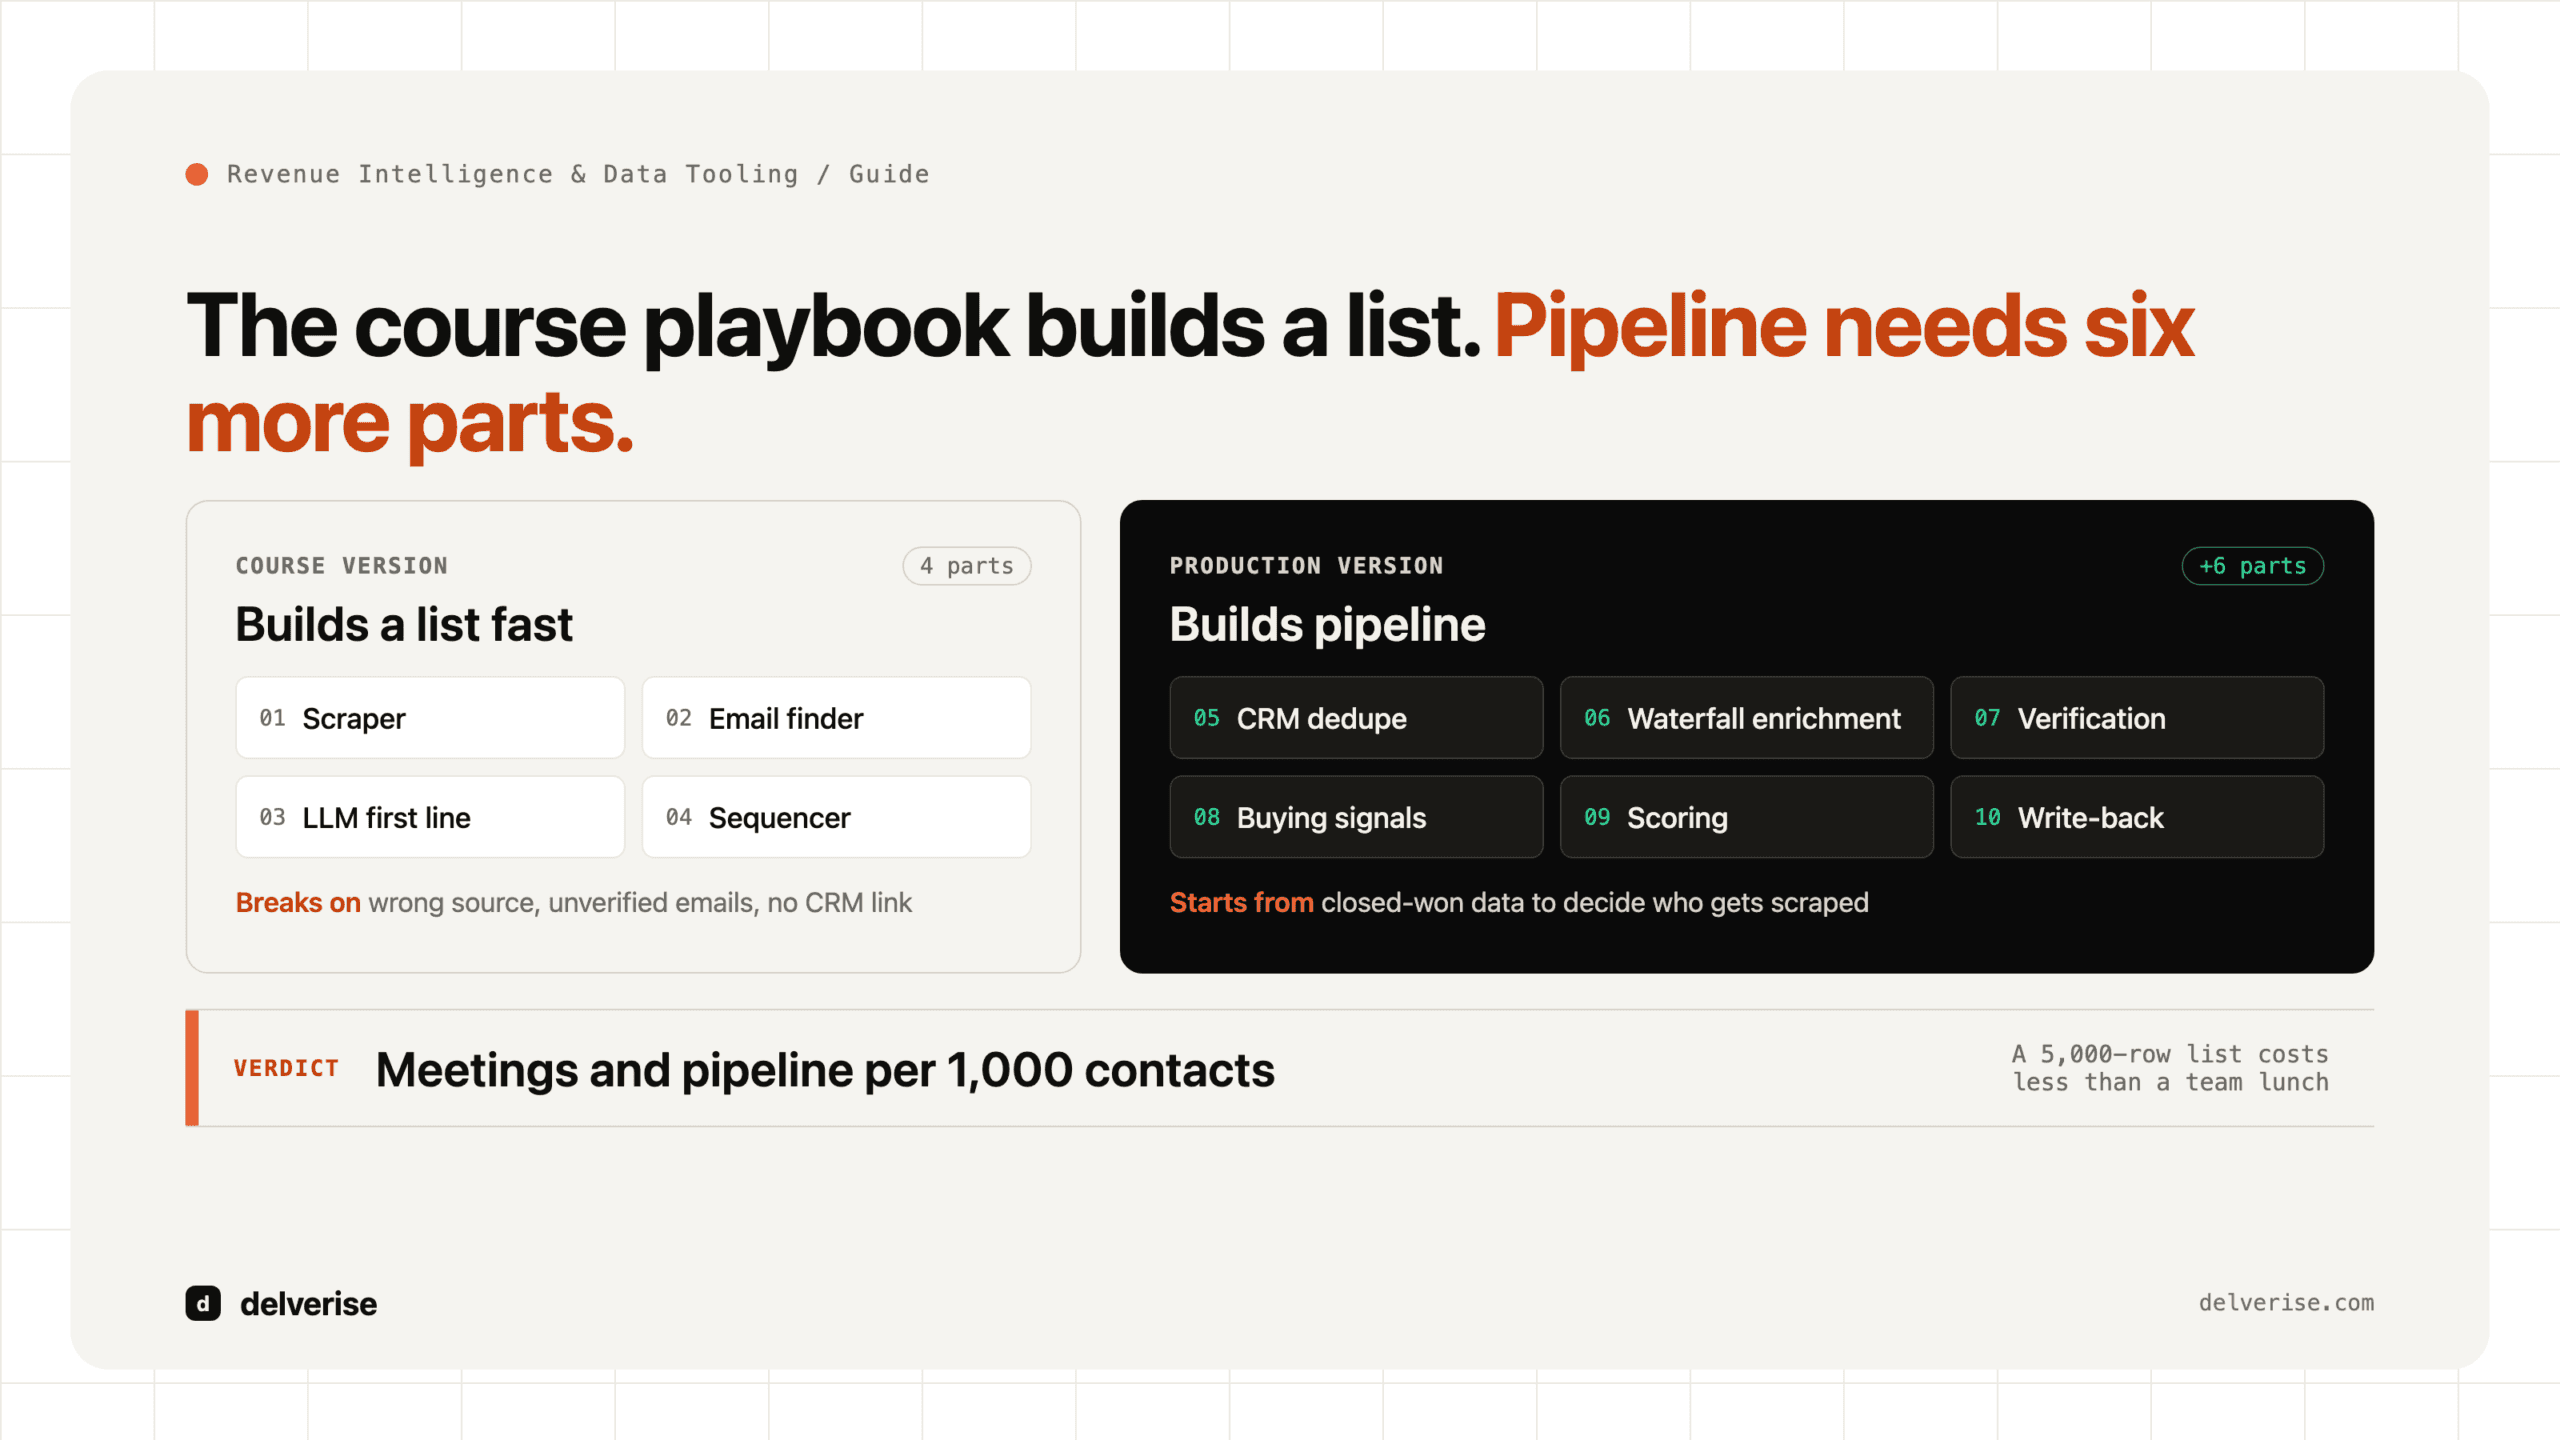
If you want the deeper mechanics of ranking accounts by readiness, our guide on lead scoring for B2B SaaS pairs directly with this. The map holds the market; scoring tells you where to start.
What data layers make a leads map useful?
Three layers do the work, and each has an honest tradeoff.

Account layer (firmographics). This defines your total addressable market, the full set of companies that match your ideal customer profile. Sources like company databases and enrichment providers populate it. The tradeoff is coverage versus accuracy: broad providers give you volume but more noise, so you spend effort filtering.
Contact layer. This adds the people, their roles, and reachable email and phone data. Match rate is the metric that decides whether this layer is worth anything. No single provider covers the full market well, which is why serious teams chain providers together. Our breakdown of the waterfall map approach explains how to route a contact through multiple sources in sequence to lift match rates instead of betting on one vendor.
Signal layer. This is where timing lives: funding, headcount changes, job postings, technology adoption, and first-party intent from your own site and product. Signals are the most perishable and the most valuable part of the map. A well-built lead intelligence platform can supply a good share of this layer, and understanding what those platforms actually do before you buy one saves real money.
How do you build a leads map without it going stale?
The failure mode is predictable. A team spends a quarter assembling a beautiful spreadsheet, celebrates, and watches it rot because nothing refreshes it. A durable leads map runs on three commitments.

First, one source of truth. Your CRM, usually Salesforce or HubSpot, holds the canonical record. Everything else feeds it rather than competing with it. Second, an orchestration layer that enriches and re-enriches on a schedule. This is where Clay earns its place for many teams: it lets you connect multiple data providers, run waterfall enrichment, and push clean records into the CRM without engineering a pipeline from scratch. It carries a learning curve and real per-credit costs, so it fits teams with defined workflows more than teams still guessing at their ICP. If you want that build done properly, our Clay partner page covers implementation help.
Third, a cadence. Decide how often each layer refreshes: firmographics quarterly, contacts monthly, signals weekly or daily depending on your sales motion. Write those cadences down and automate them.
McKinsey’s work on go-to-market has consistently linked disciplined use of analytics and data to stronger commercial growth, and the mechanism is unglamorous: teams that keep their market data current simply act on better information more often than teams that refresh once a year.
A worked example: from raw list to routed pipeline
Say you sell a mid-market HR platform. You start with a defined ICP: US companies, 200 to 2,000 employees, in industries where compliance load is high. Here is the shape of the build.
- Pull the account universe matching that ICP from a firmographic source into a working table.
- Enrich contacts for the two or three relevant roles per account through a provider waterfall to lift match rate above what any single source gives you.
- Layer signals: recent funding, active job postings for HR or compliance roles, and headcount growth over the trailing quarter.
- Grade each account on fit, then flag accounts carrying a live signal as priority.
- Sync graded, enriched records into the CRM and route priority accounts to the right reps automatically.
The output is a queryable market. A rep no longer asks “who do I call today.” They open a view: high-fit accounts with an active signal and a verified contact, sorted by grade. That is the entire point of the exercise. For the broader system this plugs into, our piece on building pipeline that compounds shows where the map sits inside a full lead engine.
Who owns the leads map inside a revenue team?
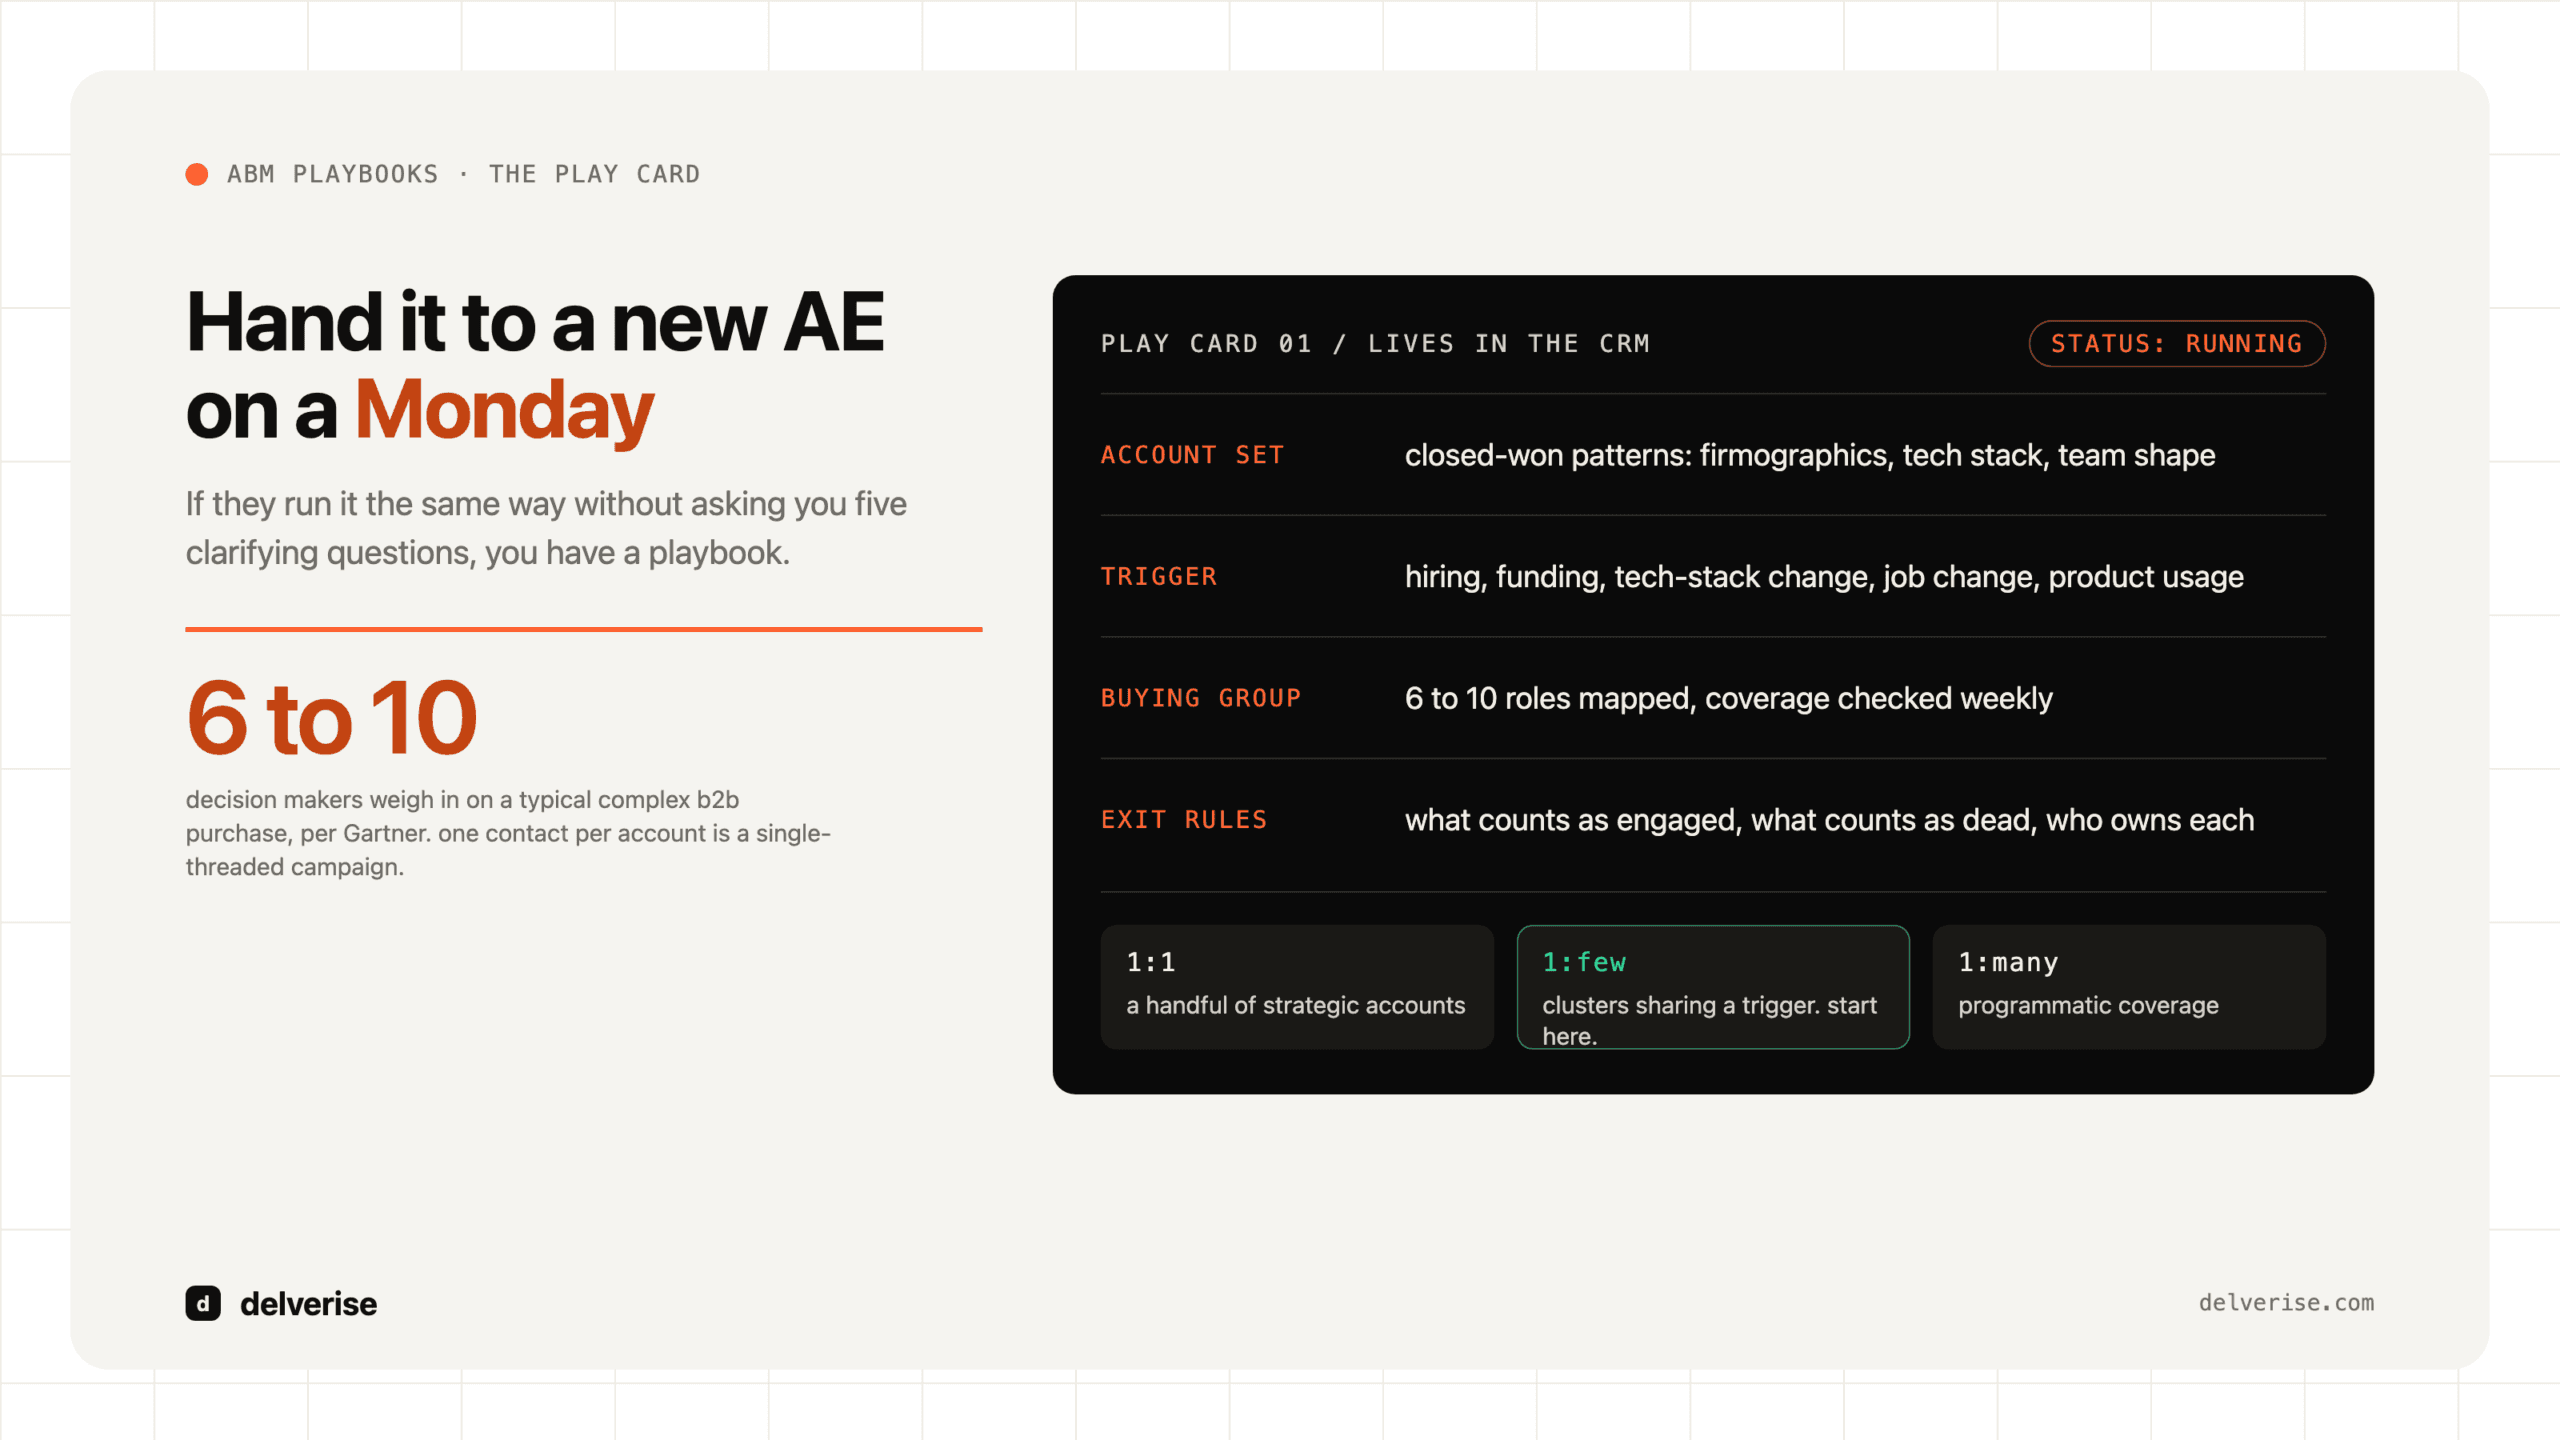
Ownership is where most maps quietly die. The data belongs to RevOps or a GTM engineering function, because those roles own the systems and the source of truth. Sales consumes the map and feeds signals back through activity. Marketing contributes first-party intent. When ownership is fuzzy, the map degrades into three conflicting versions across three tools. Our guide to the GTM roles and what each one owns is worth reading if you are deciding who should hold this. For teams building the underlying plumbing, the GTM engineering function is usually the right home, since a leads map is fundamentally a data and automation problem before it is a sales problem.
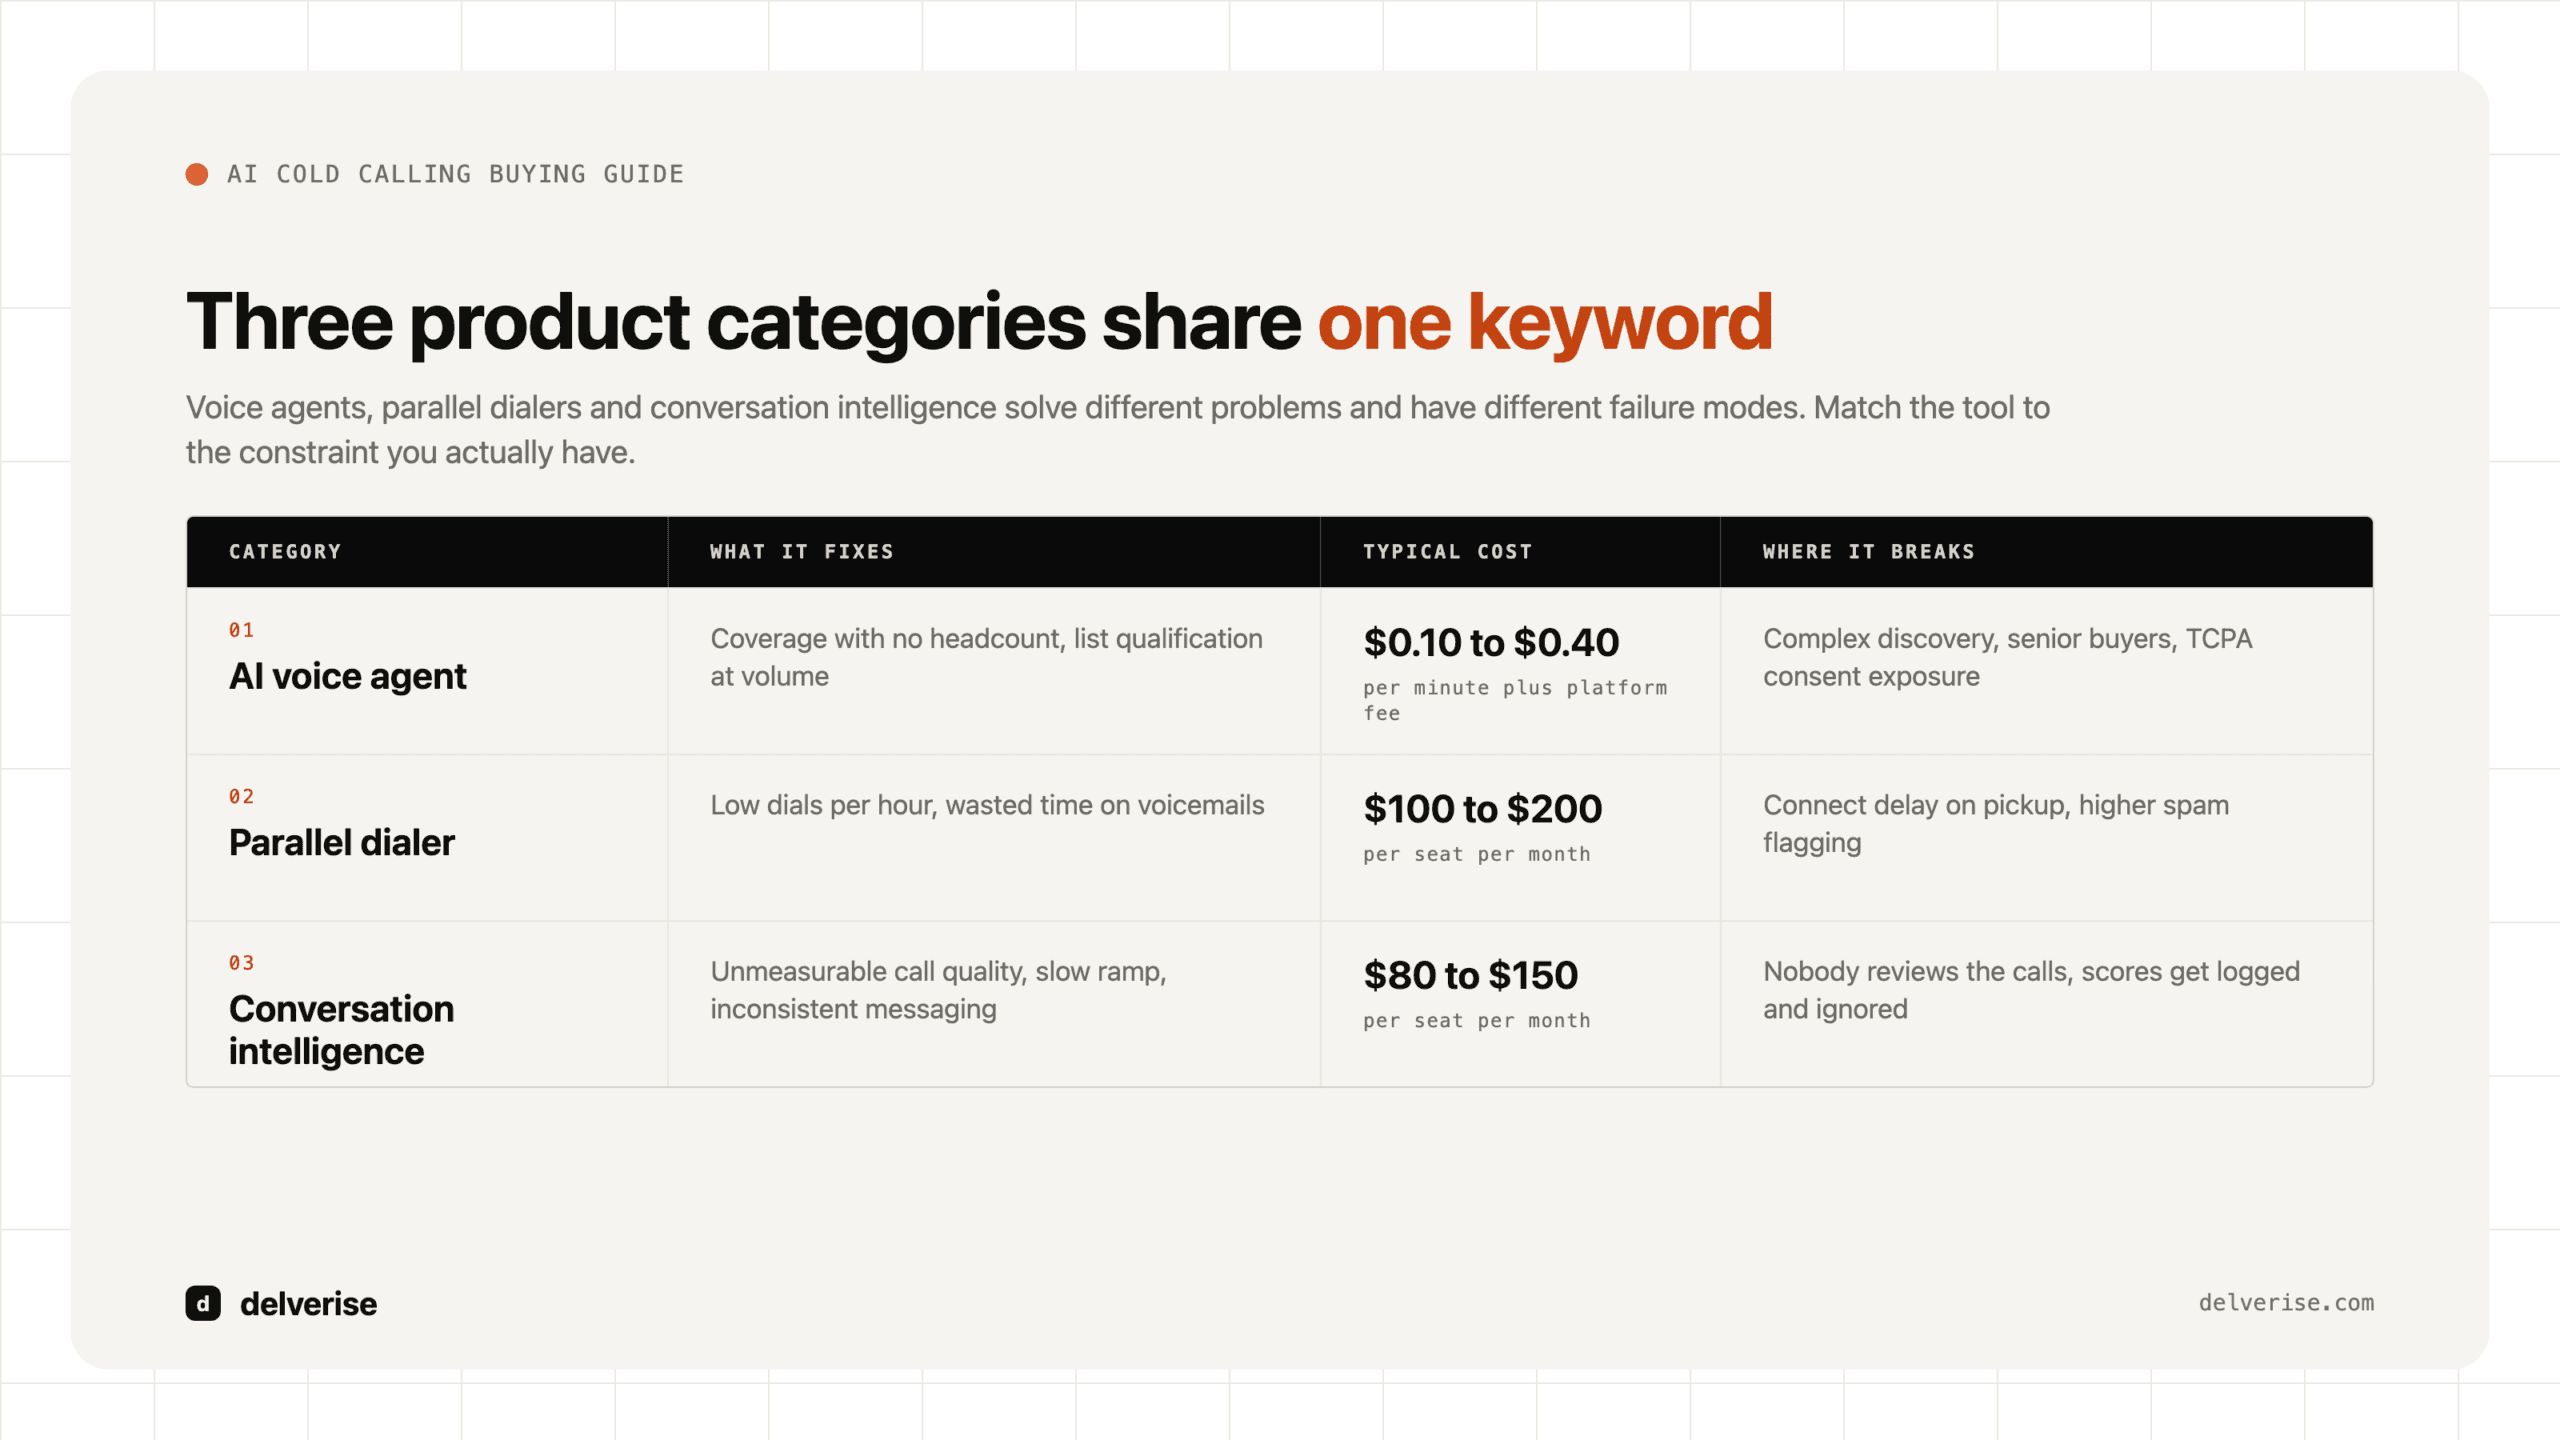
One honest caution: AI can accelerate enrichment and signal detection, and it also produces confident errors at scale. If you plan to automate research and outreach on top of the map, our review of where AI BDR tools actually break is a useful reality check before you wire anything to send on its own.
Frequently Asked Questions
Is a leads map the same as a TAM analysis?
They overlap but serve different jobs. A TAM analysis sizes the market for planning and board conversations. A leads map operationalizes that market at the account and contact level so reps can work it. Think of TAM as the number and the leads map as the addressable, reachable version of that number your team can act on this week.
What match rate should I expect on the contact layer?
It varies by segment, seniority, and geography, and any single provider will disappoint you somewhere. Teams that chain providers in a waterfall commonly lift usable match rates meaningfully above what one source delivers. Track it as a real metric per segment rather than trusting a vendor’s headline coverage claim, which is measured on their best data, not your ICP.
Do I need Clay to build a leads map?
No. You can build one with a CRM, a couple of enrichment vendors, and disciplined operations. Clay speeds up the orchestration and waterfall enrichment considerably, which is why many teams adopt it, but it is a means to the map, not the map itself. Choose it when your workflows are defined enough to justify the learning curve and credit cost.
How often should the map refresh?
Match the cadence to how fast each layer decays. Firmographics move slowly, so quarterly is often fine. Contact data degrades fast as people change jobs, so monthly refreshes keep it usable. Signals are the most perishable and reward weekly or even daily updates depending on how time-sensitive your sales motion is.
Can a small team maintain a leads map, or does it need a big ops function?
A Seed or Series A team can absolutely run one, provided it is scoped to a tight ICP and automated from the start. The trap is scope: a two-person team trying to map an enormous market will drown. Start narrow, automate the refresh, and expand the map as headcount and revenue grow rather than boiling the ocean on day one.
Read next